
Body Fat, Ideal Weight and Macros: What the Formulas Can and Cannot Tell You
How the US Navy tape equations work, why four ideal weight formulas disagree, and how to turn a calorie target into protein, carb and fat grams that suit you.
· 9 min read

Two people weigh 80 kg and stand 178 cm tall. Bathroom scales and BMI see them as identical. One has a 90 cm waist and 20% body fat; the other has an 82 cm waist and about 14%. They need different calorie targets, different protein intakes and different ideas of what "ideal weight" means. This guide covers the three tools that try to look past the scale: the Body Fat Calculator, the Ideal Weight Calculator and the Macro Calculator. For each one it explains the maths, where the numbers came from, and where your own judgement has to take over.
Nothing here is medical advice. These are estimates designed for healthy adults.
Body fat from a tape measure
The US Navy method is the most widely used tape-based estimate. In 1984 James Hodgdon and Marcie Beckett at the Naval Health Research Center measured body density by underwater weighing in several hundred sailors, then searched for a few circumferences that predicted it. For men, neck and abdomen did most of the work; for women, neck, waist and hips. The Department of Defense still publishes the inch form in Instruction 1308.3:
Men:   % fat = 86.010 × log10(waist − neck) − 70.041 × log10(height) + 36.76
Women: % fat = 163.205 × log10(waist + hip − neck) − 97.684 × log10(height) − 78.387
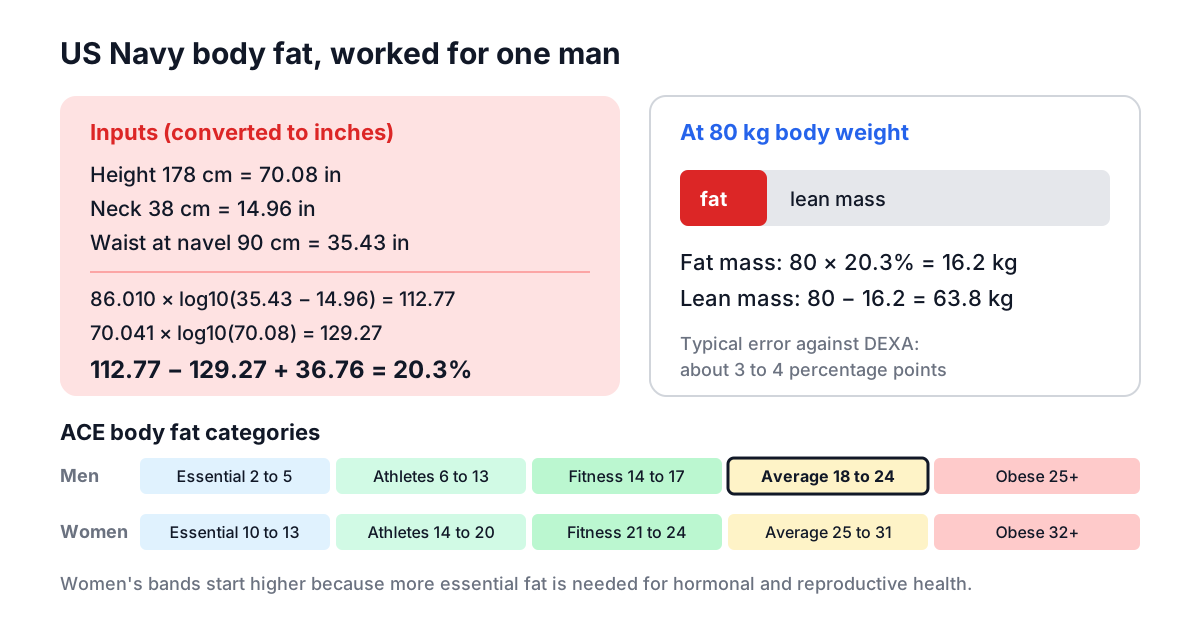
Take the first man above: 178 cm (70.08 in), neck 38 cm (14.96 in), waist 90 cm (35.43 in). Waist minus neck is 20.47 in, and log10 of that is 1.311. So 86.010 × 1.311 = 112.77, and 70.041 × log10(70.08) = 129.27. The result is 112.77 − 129.27 + 36.76 = 20.3%. At 80 kg that is 16.2 kg of fat and 63.8 kg of lean mass.
Why logarithms? Because the relationship between girth and fat is not a straight line. Doubling the gap between waist and neck does not double body fat; each extra centimetre matters a little less than the one before. The neck term exists to adjust for frame: a thick neck usually means more muscle, so it is subtracted.
There is also a metric version, built on body density and the Siri equation (495 / density − 450). It is not the DoD formula, but it agrees with it to within about half a percentage point across normal ranges. The calculator converts centimetres to inches and uses the DoD constants, so metric and US entries give the same answer.
How far to trust it
Studies against DEXA scans put the Navy method within roughly 3 to 4 percentage points for most adults. That sounds rough, but it is similar to consumer bioimpedance scales, and the tape has one advantage: if you measure the same way every time, the trend is reliable. The main errors come from technique. A tape pulled 1 cm tighter at the waist changes a man's result by about 1 point. Measure in the morning, before food, at the end of a normal breath out, twice per site.
The US Army replaced its multi-site test in 2023 with a one-site version that uses waist and body weight only. The calculator shows that figure too, along with the Deurenberg estimate from BMI and age (1.2 × BMI + 0.23 × age − 10.8 × sex − 5.4). When the BMI-based number is much higher than the tape number, it is usually telling you that you carry more muscle than average, not that the tape is wrong.
What the categories mean
The American Council on Exercise bands are the ones most often quoted. For men: essential fat 2 to 5%, athletes 6 to 13%, fitness 14 to 17%, average 18 to 24%, obese 25% and over. For women the bands start about 8 points higher, because women need more essential fat for hormonal and reproductive function: 10 to 13%, 14 to 20%, 21 to 24%, 25 to 31% and 32% and over. These are descriptions of populations. A man at 20% is ordinary, not unhealthy, and waist size and fitness predict health risk better than a few points of body fat.
Ideal weight: four formulas, one shape
The phrase "ideal body weight" sounds like a health target, but its history is clinical. In 1964 G. J. Hamwi gave dietitians a bedside rule for diabetic diet planning: 106 lb for a 5 ft man plus 6 lb per inch above that, or 100 lb plus 5 lb per inch for a woman. In 1974 B. J. Devine published 50 kg plus 2.3 kg per inch (45.5 kg for women) in a paper on dosing the antibiotic gentamicin. Pharmacists still use Devine to dose drugs and set ventilator volumes.
In 1983 two groups, led by J. D. Robinson and D. R. Miller, kept the same straight-line shape but fitted it to the Metropolitan Life Insurance height and weight tables. Their slopes are gentler: Robinson adds 1.9 kg per inch for men, Miller 1.41 kg.
| Formula | Men (kg at 5 ft + per inch) | Women |
|---|---|---|
| Hamwi (1964) | 48.1 + 2.72 | 45.4 + 2.27 |
| Devine (1974) | 50 + 2.3 | 45.5 + 2.3 |
| Robinson (1983) | 52 + 1.9 | 49 + 1.7 |
| Miller (1983) | 56.2 + 1.41 | 53.1 + 1.36 |
Because the slopes differ, the formulas cross. For a 5 ft 2 in man, Miller gives the highest answer (59.0 kg) and Hamwi the lowest (53.5 kg). At 6 ft the order flips: Hamwi gives 80.7 kg and Miller 73.1 kg. For men the lines cross between about 5 ft 5 in and 5 ft 9 in; for women the crossing happens later, between about 5 ft 7 in and 6 ft 1 in.
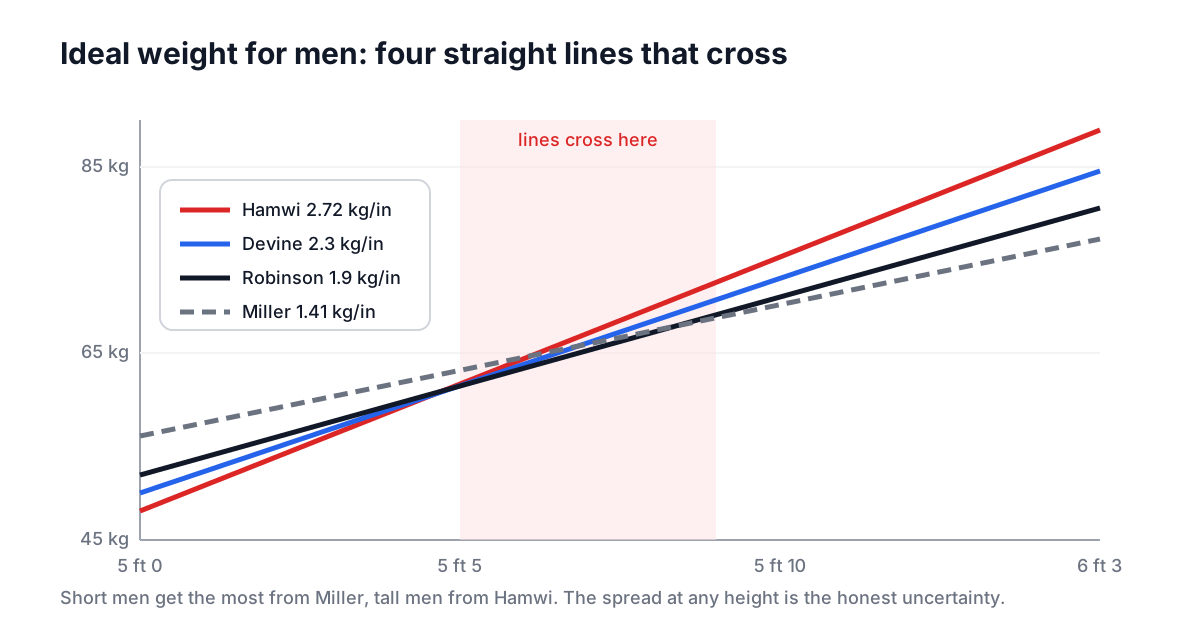
Below 5 ft none of them was designed to work; the calculator extends the slope downwards and labels the result as extrapolated.
The useful lesson is that the spread between formulas is the honest answer. For a 165 cm woman the four results run from 56.6 to 59.8 kg. The weight range that keeps her BMI between 18.5 and 24.9 is much wider: 50.4 to 67.8 kg. The BMI band at least comes from data on health outcomes, so treat it as the target and the formula results as reference points inside it. If you are muscular, you will sit above every formula and still be lean; check with the tape instead.
Macros: from calories to grams
Once you know roughly how much to eat, a macro split decides where those calories come from. The arithmetic rests on the Atwater factors that food labels still use: 4 kcal per gram of protein, 4 per gram of carbohydrate and 9 per gram of fat.
grams = (calories × share) / kcal per gram
2,000 kcal × 30% protein = 600 kcal / 4 = 150 g
The Macro Calculator can estimate calories for you with the Mifflin-St Jeor equation (10 × kg + 6.25 × cm − 5 × age, plus 5 for men or minus 161 for women) multiplied by an activity factor from 1.2 to 1.9. A 30-year-old man at 75 kg and 178 cm gets a basal rate of 1,717.5 kcal; at moderate activity (× 1.55) that is about 2,662 kcal. The Calorie Calculator explains these steps in detail, and if you already have a target from it or from a dietitian, type that in instead.
Percentages or grams per kilogram?
Percentage presets are simple but have a flaw: protein scales with calories rather than with your body. On a 1,500 kcal diet, 25% protein is 94 g, which may be too little for a 90 kg person trying to keep muscle while losing fat. That is why the calculator also lets you fix protein in grams per kilogram and let carbohydrate fill whatever is left after fat.
What number to use? The adult RDA is 0.8 g/kg, set to prevent deficiency in sedentary people. The International Society of Sports Nutrition recommends 1.4 to 2.0 g/kg for people who train, and intakes up to about 2.2 g/kg during a calorie deficit help preserve lean mass. Older adults tend to benefit from at least 1.0 to 1.2 g/kg. The Protein Calculator covers the evidence. If you know your lean body mass from the tape method, some coaches prescribe protein per kilogram of lean mass instead, which avoids overshooting for people with higher body fat.
The ranges and when to break them
The US Institute of Medicine sets Acceptable Macronutrient Distribution Ranges for adults: 10 to 35% of energy from protein, 45 to 65% from carbohydrate and 20 to 35% from fat. A balanced split of 25/45/30 sits inside all three. Low-carb, high-protein and keto diets deliberately go outside them, and the calculator points this out rather than blocking it. Keto in particular keeps carbohydrate under about 50 g a day, well below the 130 g RDA, so that the body produces ketones. It began as a medical diet for epilepsy, and anyone on diabetes or blood pressure medication should change carbohydrate intake with their clinician involved, because doses may need adjusting.
On the question everyone asks, which split is best for fat loss, controlled trials comparing low-fat and low-carb diets at equal calories find similar average weight loss. The split that works is the one you can sustain, with protein high enough to protect muscle and enough fibre (around 14 g per 1,000 kcal) to keep you full.
Putting the three together
Used together, these tools answer different questions. The body fat estimate tells you what your weight is made of. The ideal weight and BMI range give a rough destination, as a range rather than a single number. The macro split turns a calorie target into food. A sensible sequence is to measure your waist, neck and hips and record the body fat figure; set a calorie target and protein in grams per kilogram; then weigh yourself several times a week and re-measure your tape sites every two to four weeks. If weight falls and the body fat estimate falls with it, the plan is working. If weight falls but waist stays the same, raise protein and add resistance training before cutting more calories.
The BMI Calculator and Calorie Deficit Planner fill in the rest of the picture. None of these formulas replaces a conversation with a clinician if you have a medical condition, but they make that conversation far more specific.