
Chrome DevTools for Vibe Coders: What to Actually Look At
Five panels, the specific things to check in each, and how to tell a real problem from the browser-extension noise that fills every console.
By Redbison Dev · · 12 min read
You can check almost everything on the launch checklist with a tool already installed on your machine. Right-click any page, choose Inspect, and Chrome DevTools opens. It is intimidating because it was built for people who write code, and because nine of its panels are irrelevant to you.
You need five, and within those, about a dozen specific things. Here is what to open, what to look at, and how to tell a real problem from the noise that fills every console on every site on the internet.
Console: is it actually broken?
The Console shows messages your app produced while running. Red lines are errors, yellow are warnings, the rest is chatter.
The important habit is learning what to ignore, because your console will never be empty and treating every red line as yours leads to chasing ghosts.
Almost certainly not yours: anything naming a browser extension, usually with an address starting chrome-extension://. Warnings from analytics or payment scripts you did not write. A missing favicon. Blocked-resource messages caused by an ad blocker.
Yours, and worth acting on: a message naming one of your own files, anything saying undefined is not an object or cannot read properties of undefined, and any failed request to your own database or API.
One pattern deserves a name because it looks alarming and is usually benign: Failed to fetch dynamically imported module. That means the page asked for a piece of your app that no longer exists on the server, which happens when you deploy while someone has the old version open. A reload fixes it. If you see it constantly rather than just after a deploy, that is worth investigating.
To test properly, tick Preserve log before reproducing a problem, otherwise navigating clears the evidence you were trying to capture.
Network: why is it slow, and what is it sending?
Open Network, tick Disable cache, reload. You now see every file the page requested. Four columns matter.
Status. 200 is fine. 404 means a missing file. 401 or 403 is a permission refusal, which is often your row-level security doing its job. 500 means the server broke, and that one is always worth chasing. Our HTTP status code reference explains any code you do not recognise.
Size and the total at the bottom. If the total for a first visit is several megabytes, that is your answer to "why is it slow on a phone". Sort by size and look at the top three: it is usually one font file, one image, or one oversized JavaScript bundle.
Time, and the waterfall. A single request taking several seconds while everything else is quick points at a slow database query or a third-party API, not at your app generally.
Two specific checks worth running deliberately:
Repeated identical requests. Filter to Fetch/XHR, load a page that shows a list, and count. One request for the list plus one per row is the pattern that makes apps slower as they grow, described in why your vibe-coded app feels slow.
What a response actually contains. Click any request, then Response. This is how you discover a query returning every user's record when the page only displays yours: the page looks right, the data was always there. If the response is dense JSON, paste it into the JSON formatter to read it.
Use the throttling dropdown to simulate a slow connection, and the device-toolbar icon to simulate a phone. Testing on "Fast 3G" in a narrow viewport will tell you more about your real users than any amount of testing on your laptop.
Sources: is my API key in here?
Sources shows every file the browser downloaded, which is to say everything a visitor can read. This is where you answer the question from the security post: did a secret key end up in the bundle?
Press Ctrl+Shift+F (Cmd+Opt+F on a Mac) to search across all loaded files, and search for the distinctive prefix your providers use: sk_live for Stripe secret keys, sk- for OpenAI, SG. for SendGrid. A match means that key is public, and no amount of file naming changes that.
Finding your Supabase anon key or a Stripe publishable key here is expected and fine; those are designed to be public. The danger is a key that can spend money or read everything.
Application: what is stored on this device?
The Application panel shows what your app keeps in the browser: Local Storage, Session Storage and Cookies.
Two things to look for. First, what you are storing. If you find personal data or anything sensitive sitting in Local Storage, remember that any script on your page can read it, including a compromised third-party script.
Second, the session token. Most apps store one. Copy it into the JWT decoder to see what it contains and when it expires. Tokens are not encrypted, only encoded, so whatever is in there is readable by the person holding it. If you put a role or an email in the token, assume the user can see it and, more importantly, assume they can send you a modified one. Permissions must be enforced by the database, never by what the token claims.
This panel is also how you check the PECR and cookie consent question honestly: if your analytics claims to be cookieless, this is where you confirm it.
Elements: what a search engine sees
Elements shows the page as it exists now, after JavaScript has run. That is not what a crawler necessarily gets.
To see the difference, right-click the page and choose View Page Source instead. That is the file as delivered. If your headline and body text are missing there, search engines may be storing an empty page, which is the main reason an app can be invisible in search. SEO for non-coders covers what to do about it.
While you are in Elements, check you have exactly one <h1> and that your <title> differs from page to page. Generated apps commonly repeat one title across the whole site.
Headers: the security basics
Click the first request in Network, then Headers, then Response Headers. These few lines control a set of browser protections most generated apps never switch on.
Copy them into the Security Headers Analyzer, which grades them and explains each one. The tool exists because browsers deliberately hide other sites' response headers from web pages, so it cannot fetch them for you; the Network tab is how you get them.
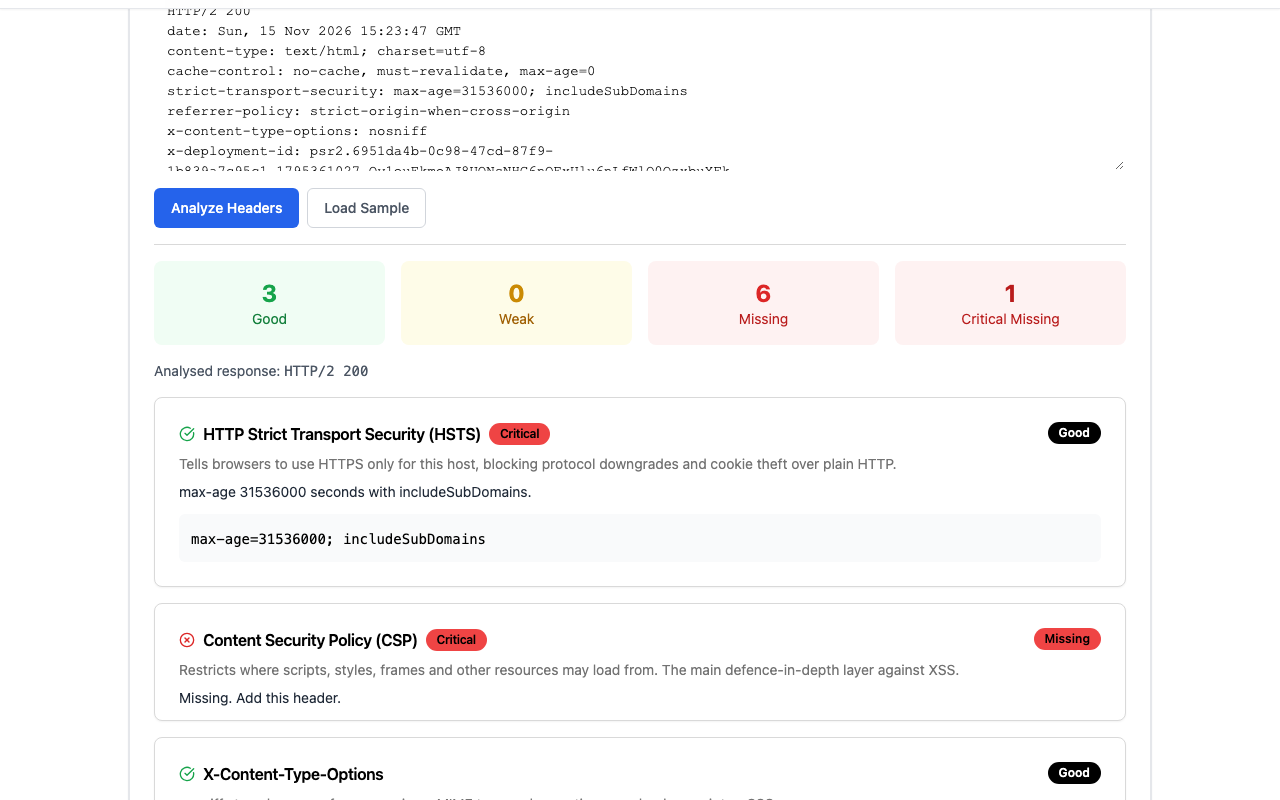
A result like that is typical and not a crisis. HSTS present is the important one. A missing Content Security Policy is worth fixing eventually, and it is the header most likely to break your own page if you add it carelessly, so it deserves a careful afternoon rather than a quick prompt.
Lighthouse: the second opinion
The Lighthouse panel runs an automated audit and gives you four scores. Run it in an incognito window, because extensions distort the results badly.
Treat Performance as a direction rather than a grade; it is one simulated run on your machine, not what your users experience. Accessibility is the most actionable of the four, because its failures are specific and usually quick: a missing label, a contrast ratio, an image without alt text. Best Practices will tell you about things like missing headers that you have already seen in Network.
A twenty-minute pass
- Console, with Preserve log on. Reproduce your main flow. Note only errors naming your own files.
- Network, Disable cache, reload. Check the total size and the three largest items.
- Filter to Fetch/XHR. Count requests on a list page. Open one response and confirm it returns only what the page should show.
- Search all sources for your providers' secret-key prefixes.
- Application. Check what is stored, and decode the session token.
- View Page Source. Confirm your text is in there.
- Throttle to Fast 3G with the phone viewport and run the main flow once.
That sequence covers most of the checklist's data-access, secrets and performance items, and it needs no tools beyond the browser you already have.
Frequently asked questions
Which DevTools panel should I learn first?
Network, with Disable cache ticked. It answers the two questions you will have most often, why a page is slow and what data is actually being sent back, and it needs no understanding of code to read. Console is second, once you can tell your errors from extension noise.
My console is full of red errors. Is my app broken?
Probably not. Most console errors on any site come from browser extensions, ad blockers and third-party scripts. Look for messages naming your own files or failed requests to your own database, and ignore anything from an address beginning chrome-extension://.
How do I know whether my API key is exposed?
Open the Sources panel and search across all files for your provider's secret-key prefix, such as sk_live or sk-. Anything that matches is readable by every visitor. Finding a publishable or anon key is expected; those are designed to be public and are limited by your database rules.
Why does the page look right in Elements but my site is not in Google?
Elements shows the page after JavaScript has run, which is not what a crawler necessarily receives. Use View Page Source to see the file as delivered. If your text is missing there, search engines may have stored an empty page, and that is a rendering problem rather than a ranking one.
Is a low Lighthouse performance score something to panic about?
No. It is one simulated run on your machine under assumed network conditions, so it indicates direction rather than what your users experience. The Accessibility section is more immediately useful, because its failures are specific, verifiable and usually quick to fix.
Sources and further reading
- Chrome DevTools, Chrome for Developers. Reference for every panel described here.
- Inspect network activity, Chrome for Developers. Reading the request table, filters and throttling.
- Lighthouse, Chrome for Developers. What each audit category measures and how it is scored.
- Content Security Policy, MDN Web Docs. The header most often missing, and why it takes care to add.
- JSON Web Token, IETF. Why a token is encoded rather than encrypted, and readable by whoever holds it.