
Heat Index and Wind Chill: How Feels-Like Temperatures Work
The NWS heat index formula step by step, dew point versus humidity, the 2001 wind chill model, its valid range, and how frostbite times and heat danger bands are set.
· 9 min read

The thermometer tells you the temperature of the air. Your body cares about something else: how fast it gains or loses heat. On a humid summer day sweat cannot evaporate, so 92°F feels like 105°F. On a windy winter morning moving air strips heat from your face, so 10°F feels like -9°F. The heat index and the wind chill index are the two standard ways to put a number on those feelings. This guide explains how each is calculated by the Heat Index Calculator and the Wind Chill Calculator, where the danger thresholds come from, and where the formulas stop applying.
Why humidity makes heat feel worse
At rest in warm weather, the body sheds most of its excess heat by sweating. Sweat cools you only when it evaporates, and evaporation slows as the air fills with water vapour. In dry air sweat flashes off and cools efficiently. In humid air it drips without doing much, the skin stays warmer, and the heart works harder to push blood to the surface.
In 1979 Robert Steadman published a detailed model of this heat balance for a clothed adult walking in the shade, accounting for skin and clothing resistance, ventilation and sweating. His result was a table of apparent temperatures: what the air would have to be, at a reference humidity, to feel the same. The heat index used by the US National Weather Service is a fit to Steadman's table.
The NWS heat index formula, step by step
The NWS Weather Prediction Center publishes the exact procedure. Temperatures are in °F and humidity is relative humidity in percent.
Step 1: the simple formula. Compute
HI = 0.5 x (T + 61 + (T - 68) x 1.2 + RH x 0.094)
If the average of this value and T is below 80°F, this is the heat index. In mild conditions the heat index is close to the air temperature and the simple form matches Steadman's values well.
Step 2: the Rothfusz regression. Otherwise, use the multiple regression derived by Lans Rothfusz in 1990:
HI = -42.379 + 2.04901523T + 10.14333127RH - 0.22475541T·RH - 0.00683783T² - 0.05481717RH² + 0.00122874T²·RH + 0.00085282T·RH² - 0.00000199T²·RH²
Step 3: adjustments. Two corrections bring the regression closer to Steadman at the edges:
- If RH is below 13% and T is between 80 and 112°F, subtract ((13 - RH) / 4) x sqrt((17 - |T - 95|) / 17).
- If RH is above 85% and T is between 80 and 87°F, add ((RH - 85) / 10) x ((87 - T) / 5).
At 92°F and 60% humidity the regression gives 104.7°F, which rounds to 105°F. At 104°F and only 10% humidity, the regression gives 98.6°F and the low-humidity adjustment takes off another 0.5°F, so the heat index sits below the air temperature. Desert heat genuinely feels less oppressive than the thermometer suggests, although dehydration is a separate and serious risk.
The regression was fitted to a limited range of Steadman's data. Very high values, above roughly 135°F, are extrapolations, and the calculator flags them as rough indications rather than precise numbers.
Dew point and relative humidity
Relative humidity is the amount of water vapour in the air as a percentage of the most it could hold at that temperature. Because warm air can hold more, relative humidity falls during the afternoon even when the moisture content stays the same. The dew point is the temperature to which the air would have to cool to become saturated. It changes only when moisture is added or removed, so it is a steadier measure of how muggy it is:
- Dew point below 55°F (13°C): dry and comfortable
- 60 to 65°F (16 to 18°C): getting sticky
- 65 to 70°F (18 to 21°C): muggy
- Above 70°F (21°C): oppressive
The calculators convert between the two with the Magnus formula, using the constants a = 17.625 and b = 243.04°C recommended by Alduchov and Eskridge (1996):
- γ = ln(RH / 100) + a·T / (b + T)
- Dew point = b·γ / (a - γ)
At 25°C and 60% relative humidity the dew point is 16.7°C. Run backwards, the same equation turns a forecast dew point into the relative humidity the heat index formula needs. A 33°C day with a 24°C dew point is 59% humidity and a heat index of about 39°C (103°F).
NWS heat categories and what they leave out
The National Weather Service groups heat index values into four bands:
| Heat index | Category | Possible effects |
|---|---|---|
| 80 to 90°F (27 to 32°C) | Caution | Fatigue with prolonged exposure or activity |
| 90 to 103°F (32 to 39°C) | Extreme caution | Heat cramps or heat exhaustion possible |
| 103 to 124°F (39 to 51°C) | Danger | Heat cramps or exhaustion likely; heat stroke possible |
| 125°F (52°C) or more | Extreme danger | Heat stroke highly likely |
Three things are not in the number. The heat index assumes shade; the NWS notes that full sunshine can raise it by up to 15°F. It assumes a light breeze, and still air is worse. And it describes an average adult at modest activity. Hard physical work, heavy protective clothing, older age, young children, pregnancy, some medications and a lack of acclimatisation all lower the temperature at which heat becomes dangerous. For outdoor work, the US OSHA and NIOSH guidance is built on wet-bulb globe temperature, which includes sun and wind, so use it where it is available.
Wind chill: the 2001 model
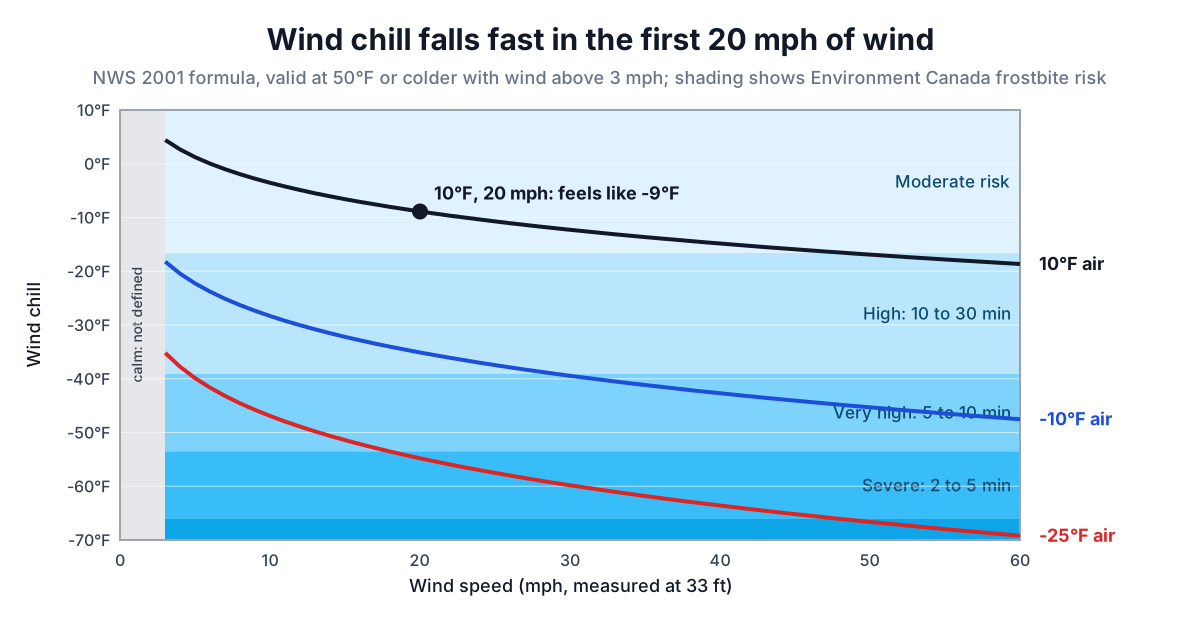
Wind chill describes the opposite problem. Moving air thins the warm boundary layer next to the skin and carries heat away faster. The first index, built by Paul Siple and Charles Passel from how fast water froze in a plastic cylinder in Antarctica in the 1940s, overstated the effect. In 2001 the US National Weather Service and the Meteorological Service of Canada adopted a new index developed by the Joint Action Group for Temperature Indices, based on a model of heat loss from a human face and tested on volunteers in a wind tunnel.
The model assumes a person walking into the wind at about 3 mph on a clear night, so no warming from the sun, and it reduces the official wind speed measured at 10 m (33 ft) to face height. The published formulas are:
- NWS, °F and mph: WC = 35.74 + 0.6215T - 35.75V^0.16 + 0.4275T·V^0.16
- Environment Canada, °C and km/h: WC = 13.12 + 0.6215T - 11.37V^0.16 + 0.3965T·V^0.16
They are the same model in two unit systems and agree to within a fraction of a degree. At 10°F and 20 mph, 20^0.16 = 1.615, and the wind chill is -8.9°F, which the NWS chart shows as -9.
Two limits come with the formula. Wind chill is defined only at 50°F (10°C) or colder, and only for wind above 3 mph (4.8 km/h). Above 50°F the index has no frostbite meaning. In calm air, the curve would give odd results, so the feels-like temperature is simply the air temperature. The Wind Chill Calculator checks both limits and explains why instead of returning a misleading number.
Frostbite times
The practical question in the cold is how long exposed skin can stay uncovered. Environment Canada's wind chill chart groups wind chill values (in °C) into risk categories:
- 0 to -9: low risk
- -10 to -27: moderate risk; frostbite possible with long exposure
- -28 to -39: high risk; skin can freeze in 10 to 30 minutes
- -40 to -47: very high risk; 5 to 10 minutes
- -48 to -54: severe risk; 2 to 5 minutes
- -55 and colder: extreme risk; under 2 minutes
The NWS chart marks the same first threshold: at a wind chill of -19°F (-28°C), exposed skin can freeze in 30 minutes. At -20°F with a 25 mph wind, the wind chill is -51°F (-46°C), firmly in the 5 to 10 minute band.
A common misunderstanding is that wind chill can freeze things that the air temperature cannot. It cannot. Wind speeds up cooling, but an object can only cool to the air temperature. A car radiator or a water pipe at 35°F will not freeze whatever the wind chill says. The index matters for living skin, which is warmer than the air and constantly losing heat.
Using feels-like numbers well
Weather apps often show a single "feels like" figure that switches between wind chill in cold weather and heat index in hot, humid weather. That is a reasonable shortcut, but the two indices answer different questions: heat index is about the body's ability to dump heat, wind chill about how fast exposed skin loses it. Neither includes sunshine, and both describe an average adult.
Treat both as estimates for planning, not medical thresholds. In heat, schedule hard work for the cooler parts of the day, drink regularly (the Hydration Calculator gives a starting amount) and watch for symptoms in yourself and others. In cold, cover exposed skin before the frostbite band says you must, stay dry and keep moving. The Heat Index Calculator and Wind Chill Calculator show the working for every result, so you can check the numbers against your local forecast.