
How to Calculate Percent Error (and What It Does Not Tell You)
The percent error formula, signed versus absolute error, negative true values, percent error versus percent difference, and how accuracy and precision show up across repeated trials.
· 8 min read
Percent error is the first piece of error analysis most people meet, usually at the bottom of a school lab report. It is a single, simple ratio, yet it causes a steady stream of lost marks: the wrong value on the bottom, a missing absolute value, a negative reference temperature, or a percent error quoted where a percent difference was needed. This article works through the formula, the variations you will see in textbooks, and the bigger picture of accuracy and precision that a single percentage cannot show. Every number here can be reproduced with the Percent Error Calculator.
The formula
Percent error compares a measured value with a value you trust, called the true, accepted, theoretical or reference value:
percent error = |measured − true| / |true| × 100
Read it in three steps. First, the error is measured − true. Second, take its size, the absolute error, and divide by the size of the true value to get the relative error, a pure number with no units. Third, multiply by 100 to express it as a percentage.
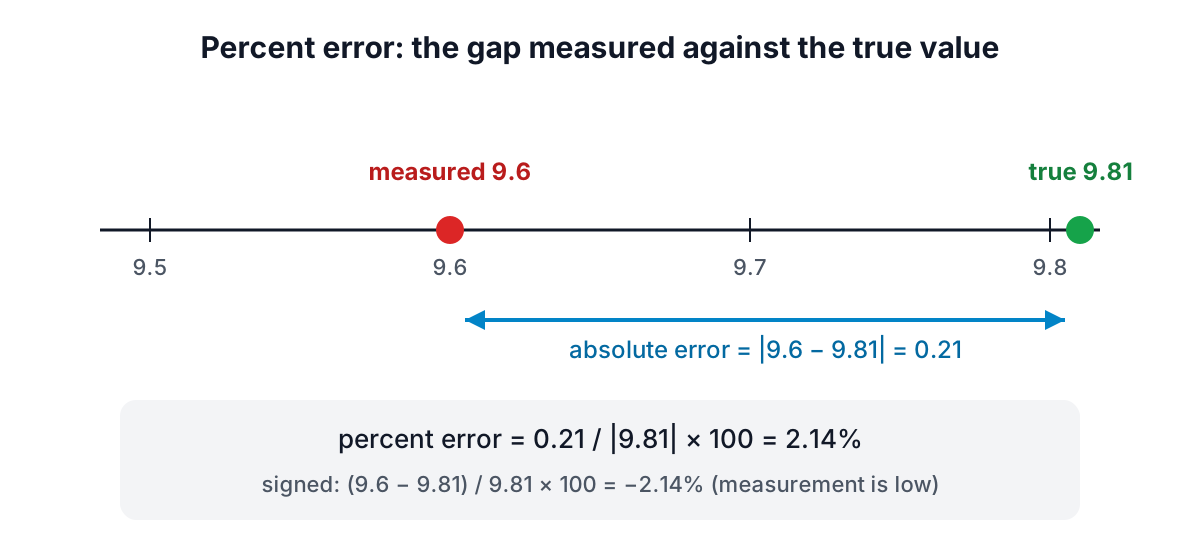
A pendulum experiment gives g = 9.6 m/s² where the accepted value is 9.81 m/s². The error is 9.6 − 9.81 = −0.21 m/s². The absolute error is 0.21 m/s², the relative error is 0.21 / 9.81 = 0.021407, and the percent error is 2.14%. Notice that the units cancel in the division, which is the point of a relative measure: a 0.21 error means a lot for a quantity near 1 and very little for one near 1000.
Signed or absolute?
The standard formula uses absolute values on top, so percent error is never negative. Many physics and chemistry courses also ask for a signed percent error:
signed percent error = (measured − true) / |true| × 100
The sign then carries information: negative means your result was low, positive means it was high. In the pendulum example the signed percent error is −2.14%. A pattern of negative signs across several experiments is a clue to a systematic effect, such as friction or a timing reaction that always cuts the period short.
Check which convention your course uses and say which one you report. The calculator shows both side by side so you can copy the right one.
Why the bottom also has absolute value bars
The denominator is |true|, not just true, so the result stays positive when the reference value is negative. If a thermometer reads −10.5 °C in a bath that should be −10 °C, the error is −0.5 °C and the percent error is 0.5 / 10 × 100 = 5%. Without the bars on the bottom you would get −5% for a reading that is too cold, which reverses the meaning of the sign.
Percent error has a hard limit: it is undefined when the true value is zero, because you cannot divide by zero. If the reference is zero, report the absolute error instead. Percent errors on temperatures measured in Celsius or Fahrenheit are also scale-dependent (an error of 1 degree is 10% at 10 °C but about 0.35% at 283 K), so in serious work compute them on an absolute scale or report the error in degrees.
Which value goes on the bottom?
Always the reference. Dividing by your own measurement gives a different number, and the gap grows with the error. Measuring 25 when the truth is 10 is a 150% error; dividing by the measurement instead would claim 60%. The convention exists because the reference is the more trustworthy of the two, so it is the right yardstick.
Sometimes neither number deserves that status: two students measure the same thing, or two instruments disagree. Then use percentage difference, which divides the gap by the average of the two values:
| Measure | Formula | Use when |
|---|---|---|
| Percent error | |measured − true| / |true| × 100 | One value is a trusted reference |
| Signed percent error | (measured − true) / |true| × 100 | You also need to know high or low |
| Percentage difference | |A − B| / ((|A| + |B|) / 2) × 100 | Neither value is the reference |
| Percent change | (new − old) / |old| × 100 | A value moved over time |
For 10 and 15, percent error against 10 is 50%, but percentage difference is 5 / 12.5 = 40%, and it is the same 40% whichever number comes first. The Percentage Calculator handles percentage difference and percent change.
Exactness and rounding
A small trap appears when the numbers are short decimals. Measuring 9.81 against a reference of 9.8 gives 0.01 / 9.8 × 100 = 5/49 percent, which is the repeating decimal 0.102040816326530612244897959183673469387755… with a 42-digit cycle. Floating-point software prints something like 0.10204081632652885 and the last few digits are noise. The calculator keeps the exact fraction and lets you choose how many decimal places to show.
Round once, at the end, and to a sensible precision. Two or three significant figures is plenty for a percent error, because the error itself is rarely known better than that. Do not round the measured value first: rounding 9.6 to 10 before computing turns a 2.1% error into a 1.9% overestimate.
Several trials: accuracy and precision
Real experiments repeat measurements, and a single percent error then hides more than it shows. Two ideas separate cleanly:
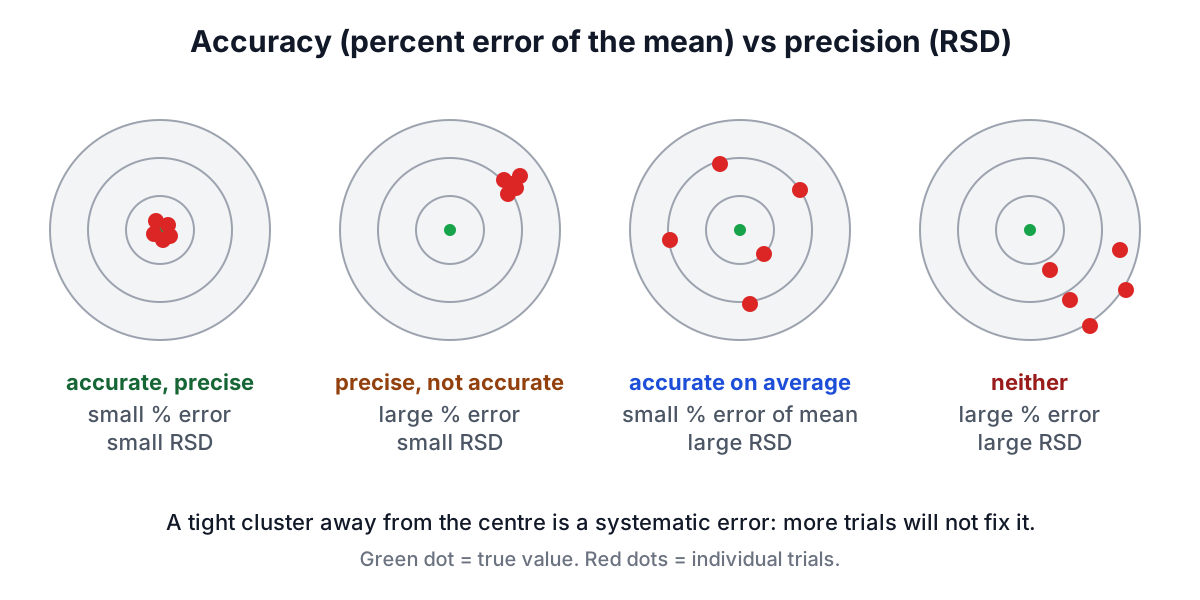
- Accuracy is how close the average is to the true value. Measure it with the percent error of the mean.
- Precision is how closely the trials agree with each other, whatever the true value. Measure it with the standard deviation, or the relative standard deviation (RSD), which is the sample standard deviation divided by the mean, times 100.
Five readings of g, 9.79, 9.82, 9.85, 9.76 and 9.80, against the standard value 9.80665 m/s² have a mean of 9.804. The percent error of the mean is |9.804 − 9.80665| / 9.80665 × 100 = 0.027%. The individual trials, though, miss by as much as 0.48%, and their sample standard deviation is about 0.034 m/s², an RSD of about 0.34%. The set is accurate on average and moderately precise: random scatter in both directions mostly cancelled out.
The reverse case is more dangerous. Five readings of 9.60, 9.61, 9.60, 9.62 and 9.61 have an RSD near 0.1%, so they look excellent, yet the mean is 2% low. That is the signature of a systematic error, such as a stopwatch that starts late or a ruler with a worn end. More trials will not fix it; only a change in method or calibration will. This is why lab reports ask for both numbers, and why the calculator's trials mode shows them next to each other.
A third summary, the mean absolute percent error (MAPE), averages each trial's own percent error. It is never smaller than the percent error of the mean, because averaging the trials first lets highs and lows cancel. Forecasters use MAPE to judge how far individual predictions miss; scientists more often report the percent error of the mean together with the RSD.
Sample or population standard deviation?
For a handful of trials, use the sample standard deviation, which divides by n − 1 rather than n. With the classic data set 2, 4, 4, 4, 5, 5, 7, 9, the population standard deviation is exactly 2, but the sample value is 2.138, and the sample value is the honest estimate of scatter when the readings are a sample of all the readings you could have taken. The Standard Deviation Calculator shows both.
What counts as a good percent error?
There is no universal threshold. Introductory labs often treat under 5% as acceptable and under 1% as very good, but that is a teaching convention, not a scientific standard. The right comparison is with the uncertainty of your method. A kitchen scale specified to ±1 g cannot give a 0.01% error on a 50 g sample, and a calibrated analytical balance that misses by 1% has a problem.
The international Guide to the Expression of Uncertainty in Measurement (GUM, published as JCGM 100) makes a related point: the true value of a quantity is never known exactly, so a complete result is the measured value with its uncertainty, for example g = 9.80 ± 0.03 m/s². A percent error is a useful check against a reference, but it does not replace an uncertainty estimate.
A checklist for lab reports
- Write the formula you used, including whether it is signed.
- Put the reference value on the bottom and say where it came from (data book, defined constant, manufacturer).
- Keep full precision through the calculation and round the final percentage to two or three significant figures.
- For repeated trials, report the percent error of the mean and the RSD, and comment on which is larger.
- Discuss sources of error by type: random (scatter, shown by the RSD) or systematic (bias, shown by a consistent sign).
The Percent Error Calculator does steps 3 and 4 for you, with exact arithmetic and the working laid out so you can copy it into your report. If you need to round the result to a set number of figures, the Rounding Calculator shows the rule it used.
Sources
- JCGM 100:2008, Evaluation of measurement data: Guide to the expression of uncertainty in measurement (GUM), Joint Committee for Guides in Metrology.
- JCGM 200:2012, International vocabulary of metrology (VIM), definitions of measurement error, accuracy and precision.
- NIST, standard acceleration of gravity g_n = 9.80665 m/s² (exact, conventional value), CODATA fundamental constants.
Related searches
- percent error formula
- how to calculate percent error in a lab
- signed percent error
- percent error vs percent difference
- accuracy vs precision in measurements
- relative standard deviation
- percent error of the mean
- what is a good percent error