
How to Calculate Your Net Worth (and What to Compare It With)
Assets minus liabilities done properly: which values to use, liquid net worth, net worth without home equity, and the Fed and Millionaire Next Door benchmarks.
· 9 min read

Net worth is the one number that sums up your whole financial position: everything you own, minus everything you owe. Income tells you how much flows in each year; net worth tells you how much has stuck. It is simple to define and surprisingly easy to get wrong, because the answer depends on which values you use, what you count as an asset and how you treat the house you live in. This guide walks through the calculation with a full worked example, explains the three variants the Net Worth Calculator reports (total, liquid and excluding home equity), and covers the two benchmarks people most often compare against: the Federal Reserve's median net worth by age and the "age times income divided by ten" rule from The Millionaire Next Door.
The formula: assets minus liabilities
The definition is short:
net worth = total assets - total liabilities
An asset is anything you own that has a market value: cash, investment accounts, retirement accounts, your home, other property, vehicles, a share of a business. A liability is any debt you owe: a mortgage, a home equity line, car loans, student loans, credit card balances, personal loans, money owed to family.
Net worth can be negative. Many people in their twenties have student loans larger than everything they own, and that is a normal starting point rather than a verdict. What matters more than the sign is the direction it moves from one year to the next.
The calculator groups each line into a type, because the types behave differently. Assets are sorted into cash and savings, taxable investments, retirement accounts, primary home, other real estate, vehicles, business interests and other. Liabilities are sorted into the mortgage on your primary home, HELOC or home equity loan, auto loans, student loans, credit cards, personal loans and other debts. Those groups drive the liquid and home equity figures described below.
A worked example
Take a 40-year-old household with a pre-tax income of $110,000 and this balance sheet:
| Assets | Value | Liabilities | Balance |
|---|---|---|---|
| Checking and savings | $15,000 | Mortgage | $280,000 |
| Brokerage account | $40,000 | Car loan | $12,000 |
| 401(k) and IRA | $120,000 | Credit card | $2,500 |
| Home | $400,000 | ||
| Car | $18,000 | ||
| Total assets | $593,000 | Total liabilities | $294,500 |
Net worth is $593,000 - $294,500 = $298,500.
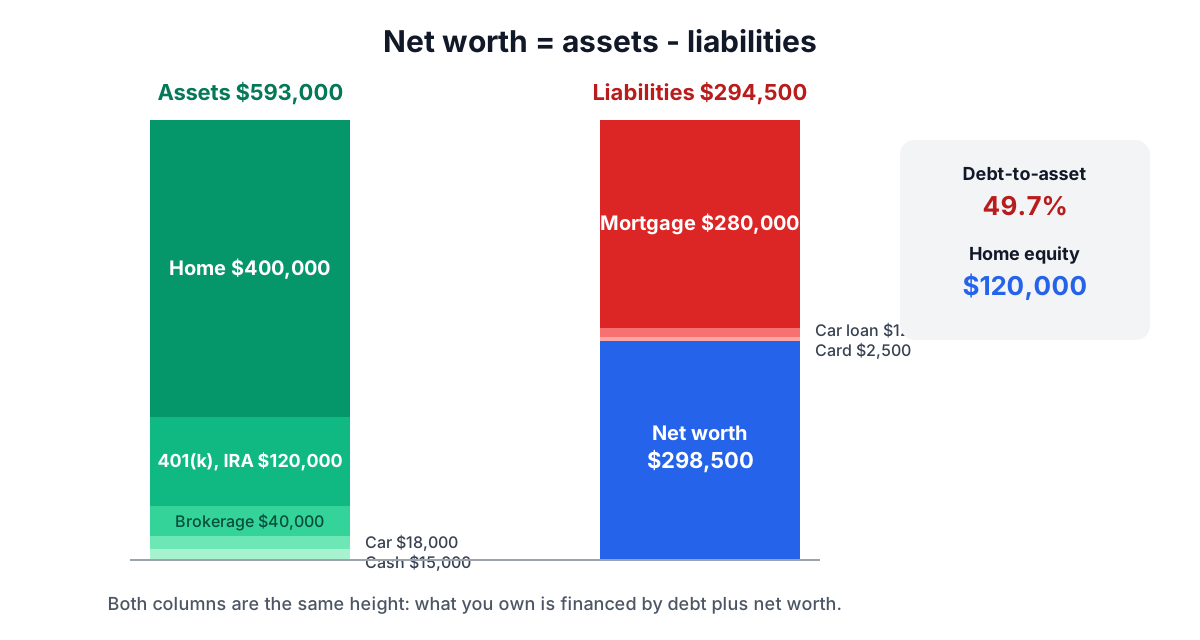
The breakdown is as useful as the total. The home is 67.5% of all assets and the mortgage is 95.1% of all debt, so most of this household's position is tied up in one property. The debt-to-asset ratio, total liabilities divided by total assets, is $294,500 / $593,000 = 49.7%: roughly half of what they own is financed. That ratio tends to fall over a working life as the mortgage is paid down and savings grow.
Which values to use
Every figure on a net worth statement should be a value you could actually realise or would actually have to pay today. That rule settles most questions.
- Use market value, not purchase price. A car bought for $35,000 four years ago is worth what a dealer or private buyer would pay now. A house is worth what comparable homes nearby are selling for, not what you paid or what you hope for. Online estimates are a starting point; recent sales of similar homes are better.
- Use the payoff balance for debts. For a mortgage or car loan that is the principal outstanding, which your lender shows on the statement or the payoff quote. Do not add the future interest you will pay over the life of the loan; it is not owed yet.
- Count retirement accounts at their full balance, and know what that means. A $120,000 traditional 401(k) is not $120,000 of spending power: withdrawals are taxed as income, and early withdrawals may carry a 10% additional tax. Most net worth statements, including the Federal Reserve's, still count the full balance, and so does the calculator. If you want a cautious view, enter traditional accounts at an after-tax estimate.
- Leave out things with no resale value. Furniture, clothes and electronics are usually worth a fraction of their cost. Including them at purchase price inflates the number. Jewellery, art or collectibles with a real market can go under other assets at a realistic sale value.
- Do not count future income. A pension you will receive, a salary or an expected inheritance is not an asset on the statement. Some people track the present value of a defined benefit pension separately; keep it out of the headline figure so year-to-year comparisons stay clean.
Consistency matters more than precision. If you value the house the same way each year, the change in net worth is meaningful even if the absolute number is a little off.
Liquid net worth and net worth without the house
A single total hides how much of your wealth you can actually use. The calculator therefore reports two more figures.
Liquid net worth. Liquid assets are the ones you can turn into cash within days without a penalty or a forced sale: cash and savings plus taxable investment accounts. In the example that is $15,000 + $40,000 = $55,000. The calculator defines liquid net worth as liquid assets minus all liabilities:
liquid net worth = $55,000 - $294,500 = -$239,500
That figure is strongly negative for almost every homeowner, because the mortgage is counted but the house is not. Read it as "if every debt had to be repaid tomorrow from money I can reach quickly, how far short would I be". Definitions vary between sources: some subtract only short-term or unsecured debts, and some include retirement accounts as liquid after tax and penalties. The formula used here is shown on the page so you know exactly which version you are looking at. For the separate question of how many months of spending your cash covers, use the Emergency Fund Calculator.
Net worth excluding home equity. Home equity is the value of your primary home minus the mortgage and any HELOC secured on it: $400,000 - $280,000 = $120,000. Subtracting it from net worth gives $298,500 - $120,000 = $178,500. This is the part of your wealth that is not your own front door. It matters for retirement planning because you cannot spend home equity without selling, downsizing or borrowing against the house, and you still need somewhere to live.
| Measure | Formula | Example |
|---|---|---|
| Net worth | All assets - all liabilities | $298,500 |
| Liquid assets | Cash + taxable investments | $55,000 |
| Liquid net worth | Liquid assets - all liabilities | -$239,500 |
| Home equity | Primary home - mortgage - HELOC | $120,000 |
| Net worth excluding home | Net worth - home equity | $178,500 |
| Debt-to-asset ratio | Liabilities / assets | 49.7% |
Benchmark one: median net worth by age
The best public data on US household wealth is the Federal Reserve's Survey of Consumer Finances (SCF), run every three years. The 2022 survey, published in the Federal Reserve Bulletin in October 2023, reports these medians by the age of the head of the family, in 2022 dollars:
| Age of family head | Median net worth (2022) |
|---|---|
| Under 35 | $39,000 |
| 35 to 44 | $135,600 |
| 45 to 54 | $247,200 |
| 55 to 64 | $364,500 |
| 65 to 74 | $409,900 |
| 75 or older | $335,600 |
The example household, at $298,500, is well above the $135,600 median for families headed by someone aged 35 to 44.
Three cautions apply. First, these are medians: half of families have less and half have more. Means are far higher (the Bulletin reports means several times the median in every age group) because a small number of very wealthy families pull the average up, which is why the median is the better comparison. Second, the figures are per family, not per person, so a couple should compare their combined net worth. Third, they are 2022 dollars and the survey counts the full value of retirement accounts and homes, the same way the calculator does.
Benchmark two: the Millionaire Next Door rule
In The Millionaire Next Door (1996), Thomas Stanley and William Danko proposed a rule of thumb for what someone "should" be worth given their age and income:
expected net worth = age x pre-tax annual household income / 10
They used realised income from all sources except inheritances. Someone with twice the expected figure they called a "prodigious accumulator of wealth"; someone with half or less, an "under accumulator of wealth".
For the example household: 40 x $110,000 / 10 = $440,000. Their $298,500 is 68% of that, between the two labels. The calculator shows this percentage when you enter age and income.
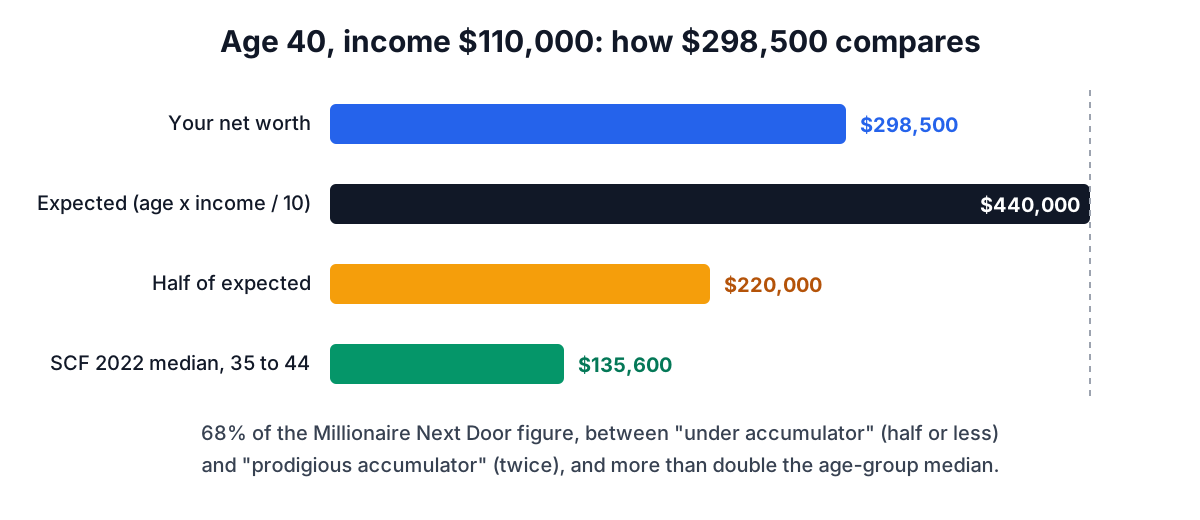
Treat the rule with care. It was built for established, mid-career earners. A 25-year-old with $60,000 of income "should" have $150,000, which is almost impossible straight out of school. High earners early in a career, people who changed careers, and anyone who spent years in education will look behind by this measure for perfectly good reasons. It is most useful as a long-term direction of travel: are you closing the gap or not?
Tracking it over time
A net worth figure is most useful as a series. Pick one date a year (or a quarter), fill in the same lines with the same valuation method, and record the totals. The calculator's Share link stores every row in the URL, so you can bookmark the statement and update it next time rather than starting from scratch.
When you compare two dates, split the change into its causes:
- Saving and debt repayment. Money you put aside and principal you paid off. This part is under your control and is the steadiest driver.
- Market movements. Changes in investment and home values. These can swamp saving in any single year, up or down.
- New debt. A car loan raises liabilities by the amount borrowed while the car, a depreciating asset, starts losing value at once.
If net worth fell because markets fell, the plan may be fine. If it fell because credit card balances rose, that is the line to work on, and the Debt Payoff Calculator shows how fast different repayment orders clear it. To raise the saving side, the Budget Planner helps find the monthly surplus, and the Retirement Calculator shows whether the investment portion is on course.
Common mistakes
- Counting the house at purchase price or an optimistic estimate. Use realistic market value, and remember that selling costs (agent fees, transfer taxes) would take a slice.
- Forgetting small debts. Buy-now-pay-later plans, medical bills and money owed to relatives are liabilities too.
- Counting the same thing twice. A brokerage account and the shares in it are one asset, not two.
- Comparing to the wrong benchmark. Compare household to household, median to your figure, and in roughly the same year's dollars.
- Treating the number as a score. Net worth measures accumulated savings, not financial security. A household with lower net worth but a solid emergency fund and no high-interest debt may be in a safer position than one with a large, highly leveraged property.
Sources
- Federal Reserve Board, "Changes in U.S. Family Finances from 2019 to 2022: Evidence from the Survey of Consumer Finances", Federal Reserve Bulletin, October 2023 (median and mean net worth by age of family head, 2022 dollars).
- Federal Reserve Board, Survey of Consumer Finances, definitions of assets, debts and net worth.
- Thomas J. Stanley and William D. Danko, The Millionaire Next Door: The Surprising Secrets of America's Wealthy, Longstreet Press, 1996 (expected net worth rule and the accumulator categories).
- IRS Publication 590-B, Distributions from Individual Retirement Arrangements, on the taxation of traditional IRA withdrawals and the additional tax on early distributions.
Related searches
- how to calculate net worth
- liquid net worth
- net worth by age
- median net worth by age
- net worth excluding home equity
- millionaire next door formula
- is a 401k part of net worth
- should i count my car in net worth
- debt to asset ratio
- net worth statement