
PEST and PESTLE Analysis: Writing Factors That Lead to Decisions
Where PEST came from, how it differs from PESTLE and STEEP, how to write factors with a date and an effect, and how to carry them into SWOT and scenario planning.
· 6 min read
Picture a UK meal-kit company that spends a year arguing about recipes and box prices. The things that actually move its margins come from outside the building: food inflation, delivery wage rates, rules on advertising food high in fat, sugar and salt, and a steady rise in people living alone. None of those show up in the internal dashboards until they are already costing money. A PEST analysis is the habit of looking for them on purpose, before they arrive.
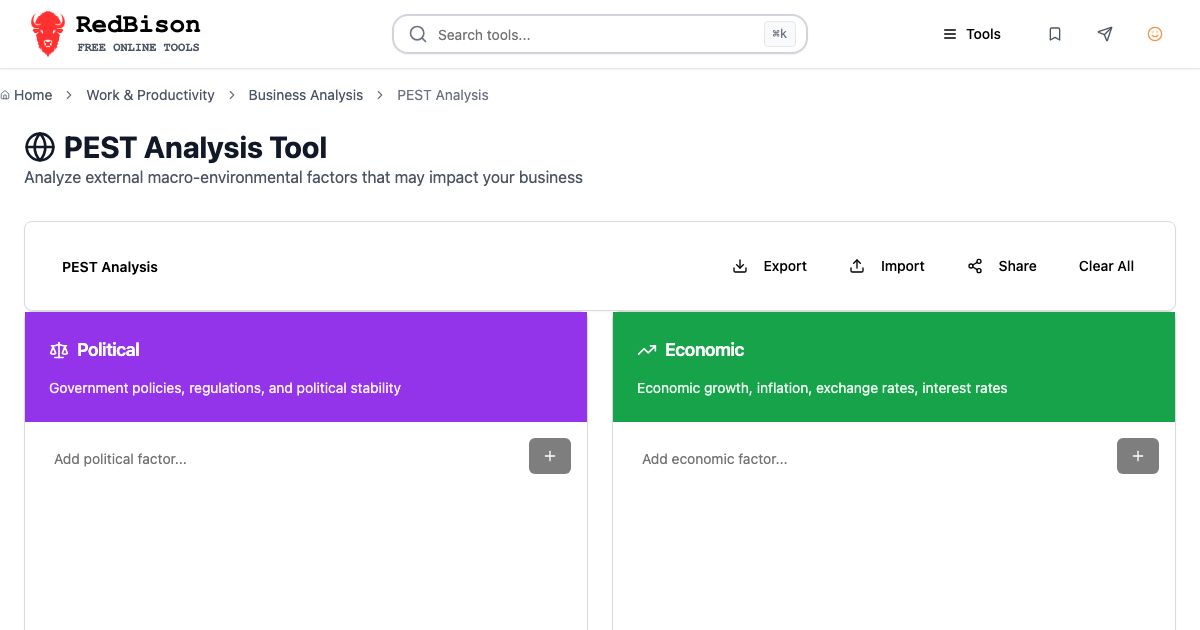
PEST stands for Political, Economic, Social and Technological. It is a structured scan of the forces no single company controls. This guide covers where it came from, how it differs from PESTLE and its cousins, how to write factors that are worth reading, and how to turn the result into decisions using the PEST Analysis Tool.
Where PEST comes from, and why there are so many letters
Francis Aguilar, a Harvard Business School professor, described the idea in his 1967 book Scanning the Business Environment. He called it ETPS: economic, technical, political and social. Later writers shuffled the letters into PEST and STEP, then added more buckets as regulation and climate became harder to ignore.
| Name | Categories | When it is used |
|---|---|---|
| PEST | Political, Economic, Social, Technological | Quick scans, smaller businesses, early-stage research |
| PESTLE / PESTEL | PEST plus Legal and Environmental | Regulated industries, public sector, most corporate strategy templates |
| STEEP | Social, Technological, Economic, Environmental, Political | Common in futures and scenario work |
| STEEPLE | STEEP plus Legal and Ethical | Sustainability and ESG reporting |
They are the same exercise with different numbers of drawers. The choice matters less than consistency: if your company's strategy pack uses PESTLE, use PESTLE so this year's analysis can be compared with last year's.
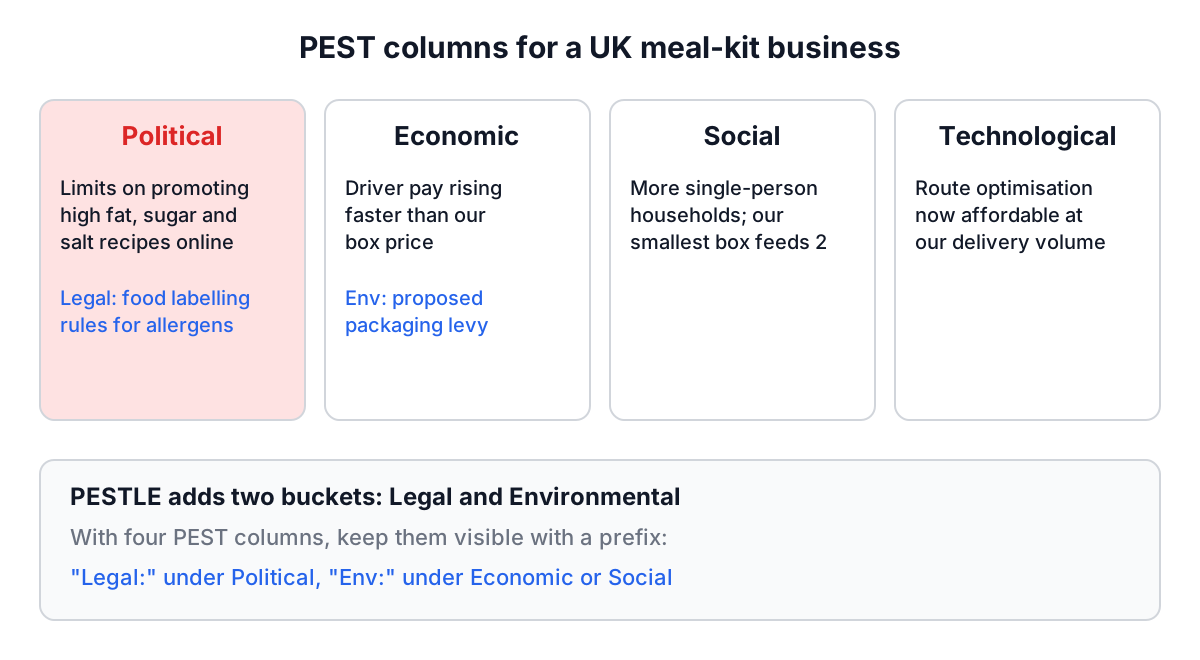
The tool here uses the four PEST columns. If you need PESTLE, put legal items under Political and environmental items under Economic or Social, and start each with a prefix such as "Legal:" or "Env:" so they can be separated later.
What a useful factor looks like
Most PEST analyses fail in the same way. The Economic column says "inflation", the Technological column says "AI", and the Social column says "changing consumer behaviour". Every one of those is true for every company on earth, which means none of them help anyone decide anything.
A useful factor has three parts:
- A specific change. What is happening, ideally with a number or a date.
- A direction. Is it growing, shrinking, starting or ending?
- An effect on you. Who pays more, who buys less, what gets cheaper or harder.
Compare these two ways of writing the same idea:
| Weak | Useful |
|---|---|
| Inflation | Grocery inflation has eased, but delivery driver pay is rising faster than our box price |
| Regulation | Restrictions on advertising high fat, sugar and salt food limit which recipes we can promote online |
| Demographics | Single-person households keep growing; our smallest box serves two |
| Technology | Route-optimisation software is now affordable at our scale and could cut delivery miles |
The right-hand column is longer, but each line already hints at a decision. That is the test: if a factor does not suggest anything you might do differently, it probably belongs in a general market report rather than your PEST.
Worked example: a meal-kit company's 12-month scan
Here is how the meal-kit team filled in the tool for its next planning cycle.
- They opened the PEST Analysis Tool and set the title to "UK meal-kit PEST, Oct 2026". The title is also used for the export file name, so this one exports as
UK_meal-kit_PEST,_Oct_2026_analysis.json. - Under Political they added the advertising restrictions on high fat, sugar and salt food, and a note on proposed packaging levies (prefixed "Env:" because it is really an environmental policy).
- Under Economic they added the gap between delivery wage growth and box price, and the cost of borrowing for a planned new depot.
- Under Social they added the growth of single-person households and the shift of younger customers toward flexible subscriptions they can pause.
- Under Technological they added cheaper route optimisation and better demand forecasting from their own order history.
- They pressed Enter after each line, checked the Analysis Summary (two or three items per column), and clicked Export to save the JSON for the planning pack.
Two of those lines turned straight into projects: a single-portion box trial and a pilot of routing software in one region. The advertising restriction became a constraint on the marketing plan. That is roughly the yield you should expect: most factors inform, a few drive action.
The board autosaves in the browser, so the team could come back to it over a week. When they wanted the finance lead to review it, they clicked Share to copy a link with the board encoded in the URL. One caution: opening someone else's share link replaces the board saved in your own browser, so export your work first.
From PEST to SWOT and scenarios
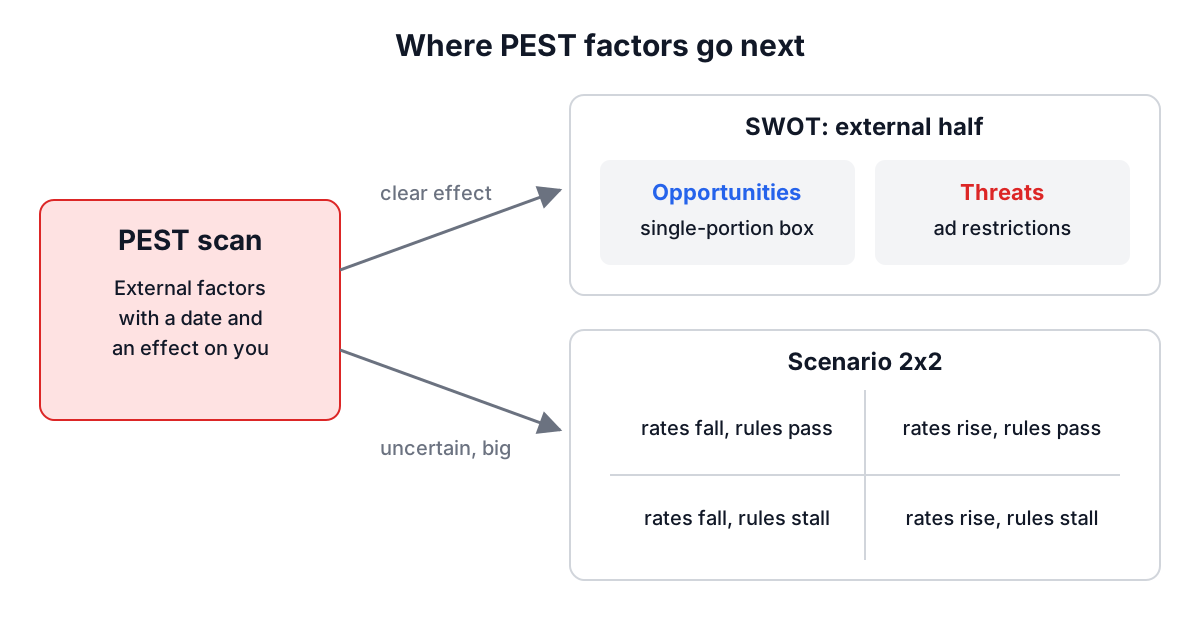
PEST answers "what is happening around us?" It does not say what to do. The usual next step is to carry the strongest factors into the Opportunities and Threats quadrants of a SWOT analysis, where they meet your internal strengths and weaknesses. The SWOT analysis guide covers that step, including the TOWS cross-match that turns four lists into options.
When a factor is both important and genuinely uncertain (will borrowing costs fall or rise, will a regulation pass or stall), it is a candidate for scenario planning instead. Pick the two most uncertain drivers, cross them in a 2x2, and you have four futures to plan against. PEST is where those drivers are found.
Common mistakes
Listing internal issues. "Our website is slow" is a weakness, not a technological factor. PEST is about the outside world. If you could fix it with a budget line, it belongs in a SWOT.
No time frame. A factor without a date ages badly. Write "from January" or "over the next two years" so readers know whether it is current.
Copying a generic template. Lists downloaded from the internet are written for no one in particular. Start from your own customers, costs and suppliers and work outward.
Treating it as a one-off. The environment changes. A PEST made in January is partly wrong by July. Revisit quarterly and after big events such as an election, a central bank decision or a new law in your sector, and delete factors that no longer apply.
Too many items. Twenty factors per column means nothing has been prioritised. Three to six well-written factors per column is plenty for most businesses.
Running a PEST session with a team
PEST works well as the opening exercise of a strategy workshop because it is low conflict: nobody's department is being judged. A format that works:
- Send the empty board link a few days ahead and ask each person to add two factors per column.
- In the session, read each column aloud, merge duplicates and delete anything generic.
- For each remaining factor, ask "what would we do differently because of this?" If no one has an answer, cut it.
- Mark the two or three factors that are most uncertain and most important. Those go to scenario planning.
- Export the JSON and attach it to the workshop notes.
Factors that have a clear probability and impact can also go onto a risk matrix, which is a better home for "this might happen and would cost us X" than a PEST column.
A good PEST fits on one screen, names real changes with dates, and leaves you with two or three things to act on. Open the PEST Analysis Tool, write one line per column for your own business today, and check whether each one passes the "what would we do differently" test before adding more.