
How to Use a 5x5 Risk Matrix (and Where Its Scores Mislead)
How likelihood x impact scoring works, why only 14 scores are possible, how to define scales before scoring, and a worked ERP go-live risk register.
· 6 min read
Two project managers score the same risk, "key ERP consultant leaves mid-project". One gives it probability 2 and impact 4, a score of 8 and a yellow cell. The other gives it 3 and 4, a score of 12 and an orange cell. Same risk, same project, different colour, and the steering committee will spend money on one and ignore the other. The disagreement has nothing to do with the consultant. It is about what "3" means.
A risk matrix is the most widely used tool in project and operational risk management, and it works well once everyone agrees on its scales. This guide explains how the 5x5 matrix is scored, where its maths misleads, how to define scales so scores are comparable, and how to build a register in the Risk Assessment Matrix.
How a 5x5 risk matrix is scored
Each risk gets two ratings from 1 to 5: how likely it is to happen (probability or likelihood) and how bad it would be if it did (impact or consequence). The score is the product, so it runs from 1 to 25.
The tool colours each cell by that score:
| Score | Level | Colour |
|---|---|---|
| 1 to 4 | Low | Green |
| 5 to 9 | Medium | Yellow |
| 10 to 16 | High | Orange |
| 20 to 25 | Critical | Red |
Because both ratings are whole numbers from 1 to 5, only fourteen scores are possible: 1, 2, 3, 4, 5, 6, 8, 9, 10, 12, 15, 16, 20 and 25. There is no 7, 11 or 18. That is why the bands jump from 16 straight to 20.
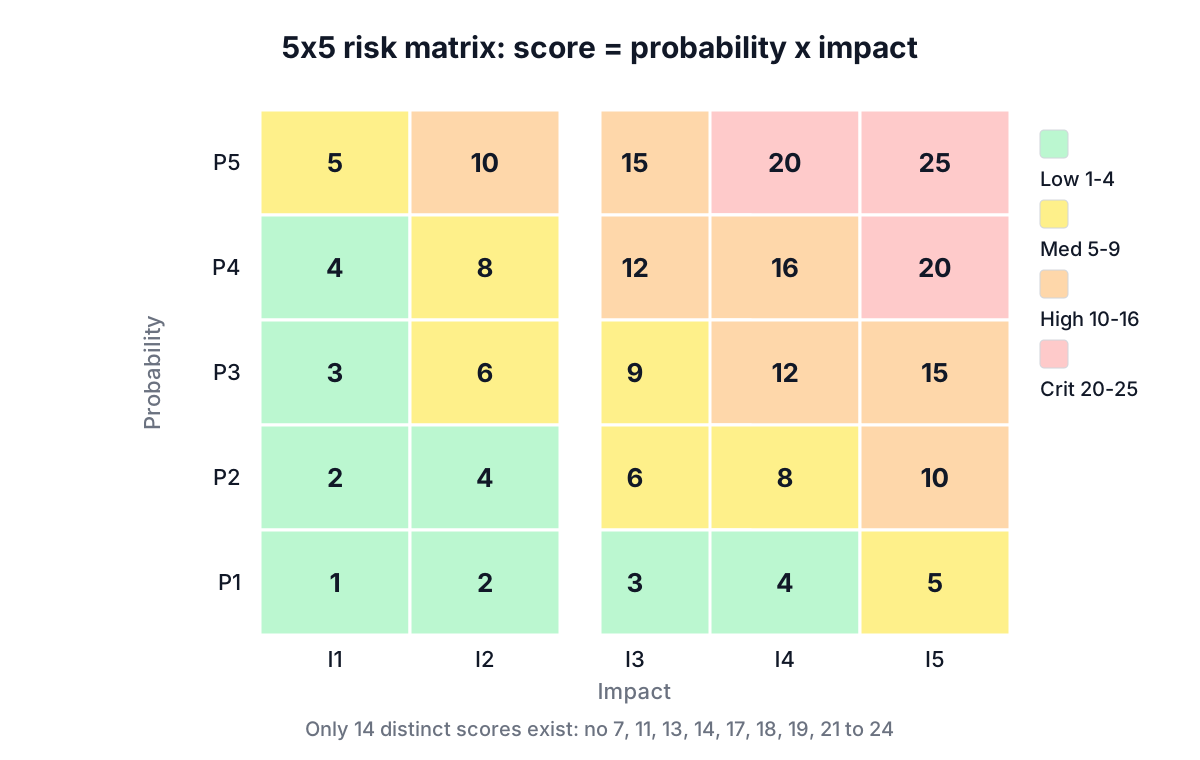
The grid is symmetric: probability 2 and impact 5 scores the same 10 as probability 5 and impact 2, and lands in the same band. Hold on to that, because it is the first of the matrix's blind spots.
Where the maths misleads
The ratings are ordinal. They put risks in order, but the distance between levels is not fixed. An impact of 4 might mean a loss of 200,000 and an impact of 5 a loss of 5 million. Multiplying ordinal numbers produces a score that looks precise and is not.
Three consequences follow.
Rare catastrophes look moderate. A data breach rated probability 2 and impact 5 scores 10, the bottom of the High band, exactly the same as a routine schedule slip with probability 5 and impact 2. Most boards would not treat those the same.
Scores do not add up. Ten Medium risks are not equivalent to two Critical ones. Summing scores across a register is meaningless.
Ties hide differences. Louis Anthony Cox Jr. set out these problems in detail in his 2008 paper "What's Wrong with Risk Matrices?" in the journal Risk Analysis, showing that matrices can rank risks in the wrong order when the underlying probabilities and losses are known.
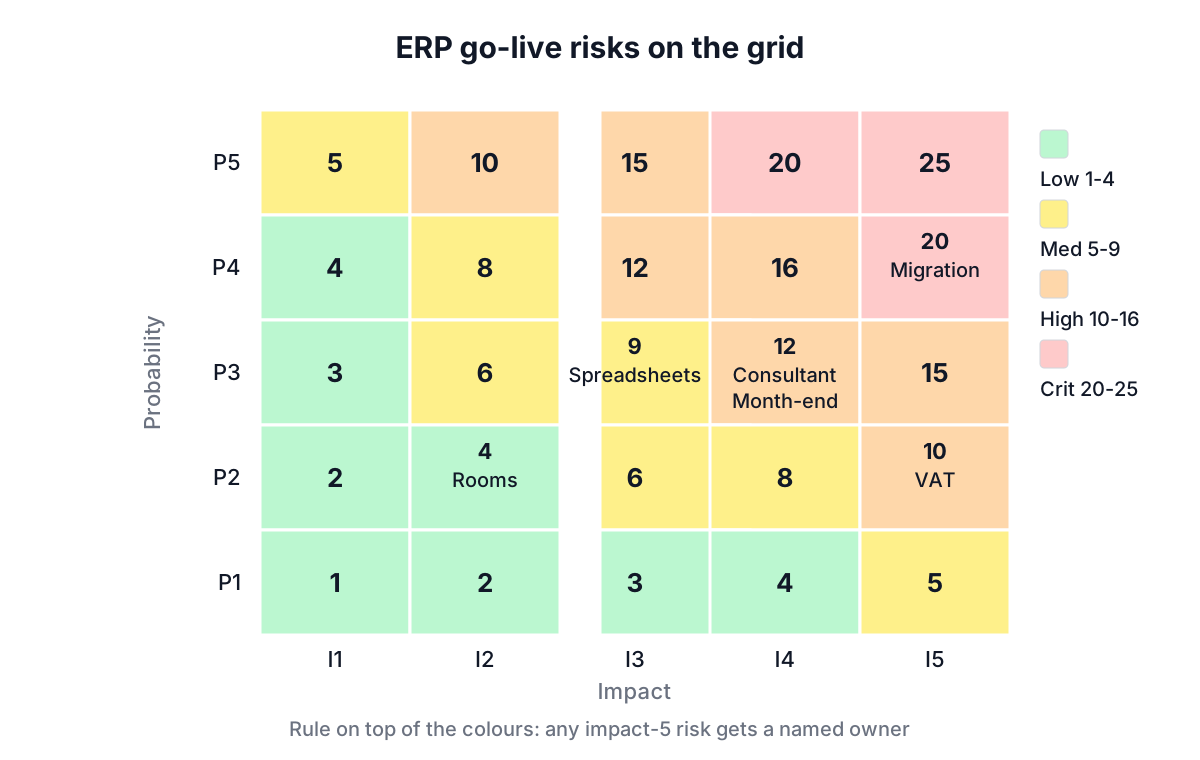
None of this means you should stop using a matrix. It means you should use it for what it does well, which is getting a team to agree on a rough order and spot the few risks that need attention, and add two simple rules: any impact-5 risk gets a named owner whatever its score, and anything that can be quantified (expected loss, days of delay) should be.
ISO 31000, the international risk management guideline last revised in 2018, asks organisations to analyse likelihood and consequence but does not mandate a matrix or particular bands. The bands in this tool are a common convention; if your organisation has its own thresholds, use those.
Define the scales before anyone scores
This is the single most effective thing you can do. Before the workshop, write one line for each level of each scale, tied to your project.
| Level | Probability (within the project) | Impact (for a 2 million ERP rollout) |
|---|---|---|
| 1 | Under 5% | Under 10,000 or under 1 day of delay |
| 2 | 5% to 20% | 10,000 to 50,000 or up to 1 week |
| 3 | 20% to 50% | 50,000 to 200,000 or up to 1 month |
| 4 | 50% to 80% | 200,000 to 500,000 or up to 1 quarter |
| 5 | Over 80% | Over 500,000, a missed go-live or a regulatory breach |
With this table on the wall, the two project managers from the opening can argue about evidence ("has this consultant been approached by a competitor?") instead of about what the numbers mean.
Worked example: an ERP go-live
A finance team moving to a new ERP system in March built its register in the Risk Assessment Matrix:
- Set the title to "ERP go-live, March 2027".
- Clicked Add Risk for each risk, entering a name, a one-line description, a Probability (1-5), an Impact (1-5), a Category (Operational, Financial, Strategic, Compliance or Technical) and a mitigation, then Add Risk in the form.
| Risk | P | I | Score | Level |
|---|---|---|---|---|
| Data migration errors in opening balances | 4 | 5 | 20 | Critical |
| Key consultant leaves mid-project | 3 | 4 | 12 | High |
| Month-end close slips during cutover | 3 | 4 | 12 | High |
| VAT reporting misconfigured | 2 | 5 | 10 | High |
| Users bypass the system with spreadsheets | 3 | 3 | 9 | Medium |
| Training rooms unavailable | 2 | 2 | 4 | Low |
Each risk appears by name in its cell on the grid, and the Risk List underneath repeats it with a score out of 25, the level badge, its category and the mitigation. Hovering a name in the grid shows its description.
The register made the next conversation easy. The migration risk is Critical and gets a dress-rehearsal migration with reconciled trial balances before go-live. The VAT risk only scores 10, but it is impact 5 and a compliance issue, so under the team's own rule it gets an owner (the tax manager) and a test plan anyway. The training room risk stays on the list and nobody spends time on it.
The page does not save between visits, so the team clicked Export after the session and stored the JSON file with the date in its name. At the next review they used Import to reload it and changed scores where the situation had moved.
Common mistakes
- Scoring without written scales. Different people will be two levels apart on the same risk.
- Mixing inherent and residual scores. Score each risk as it stands today. If you want to show the effect of mitigation, add a second entry marked "(residual)" so before and after are visible side by side.
- Writing causes or events vaguely. "Resource issues" is not a risk. "Key consultant leaves mid-project" is.
- Never revisiting. A register built at kickoff and opened at the post-mortem is a compliance artefact, not a management tool. Review the orange and red cells at every steering meeting.
- Treating the colour as the decision. The matrix tells you where to look. The decision about what to do, and how much to spend, still needs judgment and, where possible, numbers.
Related methods
A risk matrix ranks risks at the level of a project or a business. For a detailed look at how a specific product or process can fail, a Failure Mode and Effects Analysis uses three 1 to 10 ratings and works line by line through components or process steps. For big uncertain shifts that do not fit a likelihood score (a recession, a change of regulation), scenario planning is a better fit. And many risks start life as threats in a SWOT analysis.
Before your next risk review, write the five-level probability and impact definitions for your project on one page, then score the register in the Risk Assessment Matrix. The colours will mean the same thing to everyone in the room, which is most of the value.