
Average Cost per Share: Averaging Down, Break-Even and Cost Basis
The weighted average behind your broker's figure, how many shares it takes to average down to a target, what sells do to the average, and how tax cost basis differs.
· 9 min read
If you bought the same stock more than once at different prices, the number that matters for most decisions is your average cost per share. It tells you where you break even, how far underwater or ahead the position is, and how much a further purchase would move things. This guide shows the weighted average your broker calculates, the formula for how many shares it takes to average down (or up) to a target, what sells and fees do to the figure, and why the average you see on screen is not always the cost basis on your tax form. Every number below comes from the Stock Average Calculator, so you can reproduce it.
The weighted average cost
The average cost is not the average of the prices you paid. It is weighted by how many shares you bought at each price:
average cost = (shares1 x price1 + shares2 x price2 + ... + buy fees) / total shares
Suppose you bought 100 shares at $50 and later 50 more at $40.
- Cost of the first buy: 100 x $50 = $5,000
- Cost of the second buy: 50 x $40 = $2,000
- Total cost basis: $7,000 for 150 shares
- Average cost: $7,000 / 150 = $46.67
The simple average of the two prices, ($50 + $40) / 2 = $45, is wrong here because more money went in at $50. The weighted figure only equals the simple average when every purchase is the same number of shares.
The total cost, $7,000, is the cost basis. Break-even is the price at which selling every share returns exactly that: $7,000 / 150 = $46.67 before any selling fee. With a $10 commission to sell, break-even becomes ($7,000 + $10) / 150 = $46.73.
How many shares to average down to a target
Averaging down means buying more shares below your average cost to pull the average toward the current price. The useful question is how many shares a given target needs.
Let S be the shares you hold, A your average cost, P the current price and T the average you want. After buying n shares at P, the new average is (S x A + n x P) / (S + n). Setting that equal to T and solving for n gives:
n = S x (A - T) / (T - P)
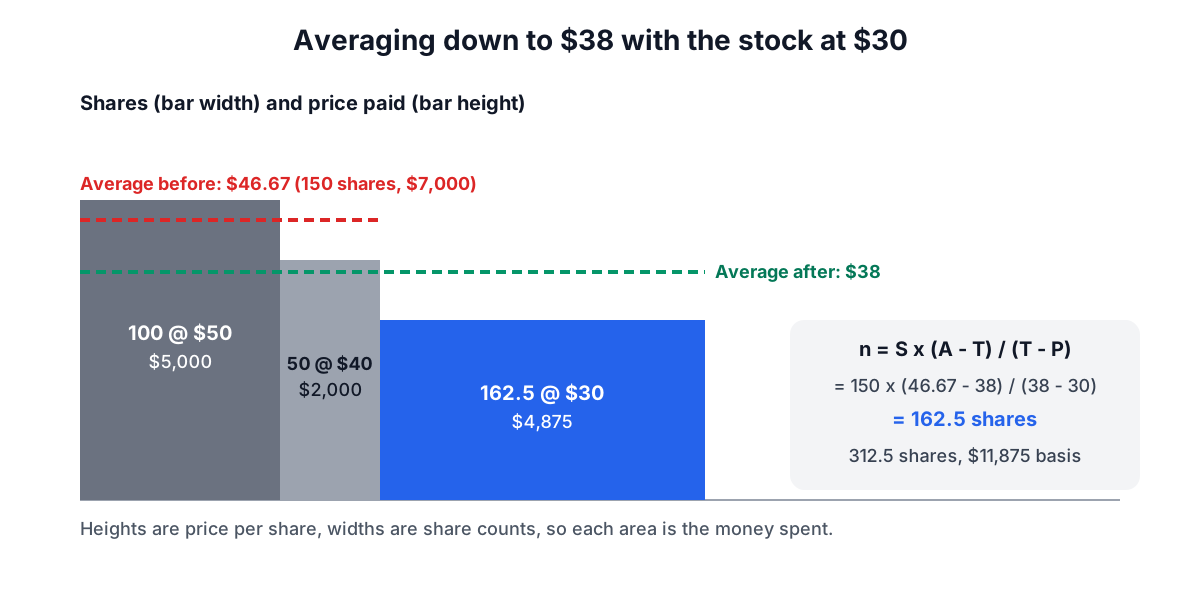
Continuing the example, the stock now trades at $30 and you want an average of $38:
n = 150 x (46.67 - 38) / (38 - 30) = 162.5 shares
162.5 shares at $30 costs $4,875. You would then hold 312.5 shares with a cost basis of $11,875, which is exactly $38 each.
Two limits follow straight from the formula:
- The target must sit between the current price and your average. Buying at $30 can only drag the average somewhere between $30 and $46.67. A target of $25 would need a negative number of shares, so the calculator says the target is out of range instead of returning nonsense.
- The closer the target is to the current price, the more shares it takes. As T approaches P, the denominator approaches zero and n heads toward infinity. Getting from $46.67 to $38 takes 162.5 shares; getting to $31 would take 2,350.
The table shows how quickly the cost climbs as the target approaches the $30 market price:
| Target average | Shares to buy at $30 | Cost of the buy |
|---|---|---|
| $42 | 58.3 | $1,750 |
| $40 | 100 | $3,000 |
| $38 | 162.5 | $4,875 |
| $35 | 350 | $10,500 |
| $32 | 1,100 | $33,000 |
The "or buy this many more" box works the other way: give it a share count and it returns the new average. Buying 100 more at $30 for $3,000 moves the average from $46.67 to $40, matching the row above.
Averaging up
The same formula works when the price is above your average. If you hold 100 shares at $40, the stock is at $60, and you are willing to let the average rise to $45, then:
n = 100 x (40 - 45) / (45 - 60) = 33.33 shares
That is $2,000 of new buying. Averaging up is how people add to a position that is working while keeping track of how much of the profit cushion they give up. The target must again lie between the average ($40) and the price ($60).
Should you average down?
The arithmetic makes a falling stock look easier to recover from: after averaging down to $38, the stock only needs to rise from $30 to $38 rather than to $46.67. The catch is that you now have $11,875 in the position instead of $7,000, so a further fall costs more money than before. Averaging down is a decision about whether the business is worth more than the market price, not about the average itself.
Questions worth asking before the next buy:
- Has anything changed in the reason you bought? A lower price is a bargain only if the value has not fallen too.
- How large is the position now as a share of your portfolio? A planned position size stops one stock from taking over.
- Would you buy at this price if you did not already own it? If not, the average is anchoring the decision.
The Stock Analysis Calculator helps with the valuation side, and the ROI Calculator shows what a recovery to a given price would return on the full amount invested.
What sells and fees do
Fees belong in cost basis. A $5 commission on a buy adds $5 to the basis; a fee on a sale reduces the proceeds. The calculator has a fee field on every trade for this reason.
Sells are handled with the average cost method: shares leave the position at the current average, so a sale never changes the average of the shares that remain. The gain or loss on the sale is:
realized gain = shares sold x sale price - sale fee - shares sold x average cost
Here is a full sequence with a $5 fee on every trade:
| # | Trade | Shares after | Average after | Realized gain |
|---|---|---|---|---|
| 1 | Buy 100 at $50 | 100 | $50.05 | |
| 2 | Buy 50 at $40 | 150 | $46.73 | |
| 3 | Sell 60 at $55 | 90 | $46.73 | $491.00 |
| 4 | Buy 40 at $45 | 130 | $46.24 |
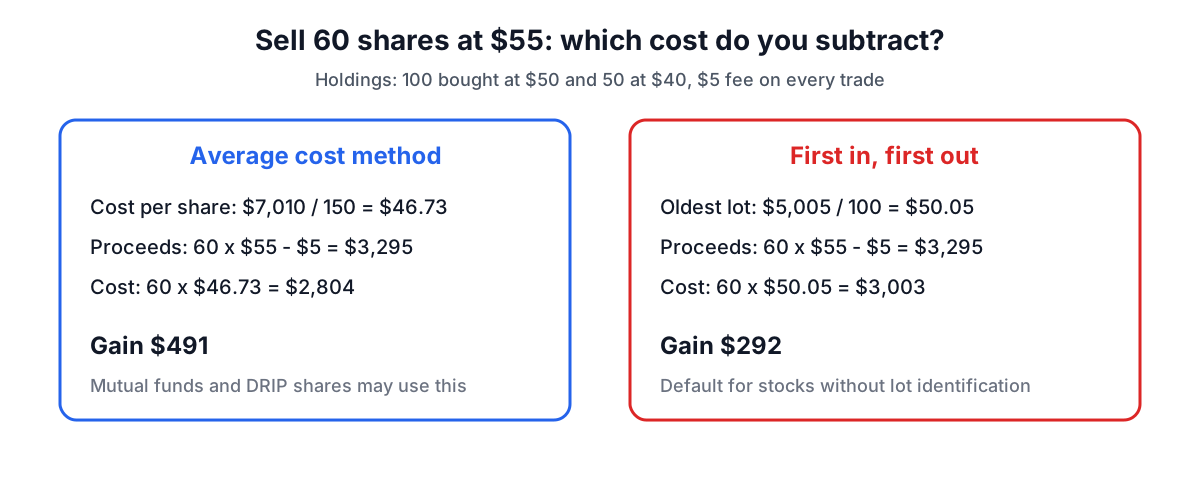
After trade 2 the basis is $5,005 + $2,005 = $7,010, an average of $46.7333. Selling 60 shares at $55 brings in $3,300 less the $5 fee, and removes 60 x $46.7333 = $2,804 of basis, so the realized gain is $491. The remaining 90 shares keep the $46.73 average. The final buy of 40 at $45 plus $5 brings the basis to $6,011 for 130 shares, or $46.24.
Average cost versus your tax cost basis
The average your broker shows on screen is a convenient summary. For US income tax, the cost basis of each sale is set by specific rules, and for individual stocks it is usually not the average.
- First in, first out is the default. Under Treasury Regulation 26 CFR 1.1012-1(c), if you do not adequately identify which shares you sold, the shares bought first are treated as sold first.
- Specific identification is allowed. You can tell your broker which lot to sell, for example the 50 shares bought at $40, at the time of the sale. Choosing high-cost lots can turn a gain into a smaller gain or a loss.
- Average basis is limited. Section 1.1012-1(e) allows the average basis method for shares of regulated investment companies (mutual funds) and for stock acquired through a dividend reinvestment plan. It is not the default for ordinary shares bought in separate trades.
Using the sequence above, FIFO would treat the 60 shares sold at $55 as coming from the first lot at $50.05, giving a gain of 60 x ($55 - $50.05) - $5 = $292, not $491. Same trades, different tax figure. Brokers report basis for covered securities on Form 1099-B, and the method they use is shown in your account settings.
Two more rules interact with averaging down:
- Wash sales. IRS Publication 550 disallows a loss if you buy substantially identical stock within 30 days before or after selling at a loss. Selling a losing lot and averaging down again within that window defers the loss into the new shares' basis.
- Holding period. Each lot has its own purchase date, so some shares may be long-term (held more than one year) and others short-term, with different tax rates.
Use the average cost for decisions about price and position size, and your broker's lot-level records for tax.
Quick checks
- Average after one more buy: (current basis + new shares x price + fee) / (old shares + new shares).
- Break-even: (cost basis + sale fee) / shares held.
- Shares to reach a target: S x (A - T) / (T - P), with T between P and A.
- Unrealized gain: shares x current price - cost basis. At $30, the original 150 shares are worth $4,500 against a $7,000 basis, a loss of $2,500 or 35.7%.
For dividend stocks where reinvested payouts add small lots every quarter, the Dividend Calculator projects how those lots build up.
Sources
- 26 CFR 1.1012-1, Basis of property; in particular paragraph (c) on sales of stock (first-in, first-out and adequate identification) and paragraph (e) on the average basis method for regulated investment company shares and dividend reinvestment plan stock.
- IRS Publication 550, Investment Income and Expenses: figuring gain or loss, holding period, and wash sales.
- IRS Publication 551, Basis of Assets: cost basis, including commissions and other purchase costs.
- U.S. Securities and Exchange Commission, Investor.gov, and FINRA investor guidance on cost basis and broker reporting of covered securities on Form 1099-B.
Related searches
- average cost per share formula
- stock average down calculator
- how many shares to buy to average down
- break even price stock
- weighted average stock price
- average cost basis method
- fifo vs average cost
- does selling change average cost
- averaging up
- cost basis with fees