
What BMI Measures: the Formula, the Cut-offs and Where It Fails
How kg/m² and 703 × lb/in² work, where the 18.5, 25 and 30 cut-offs came from, why children use percentiles, and what BMI cannot see about body composition.
· 6 min read
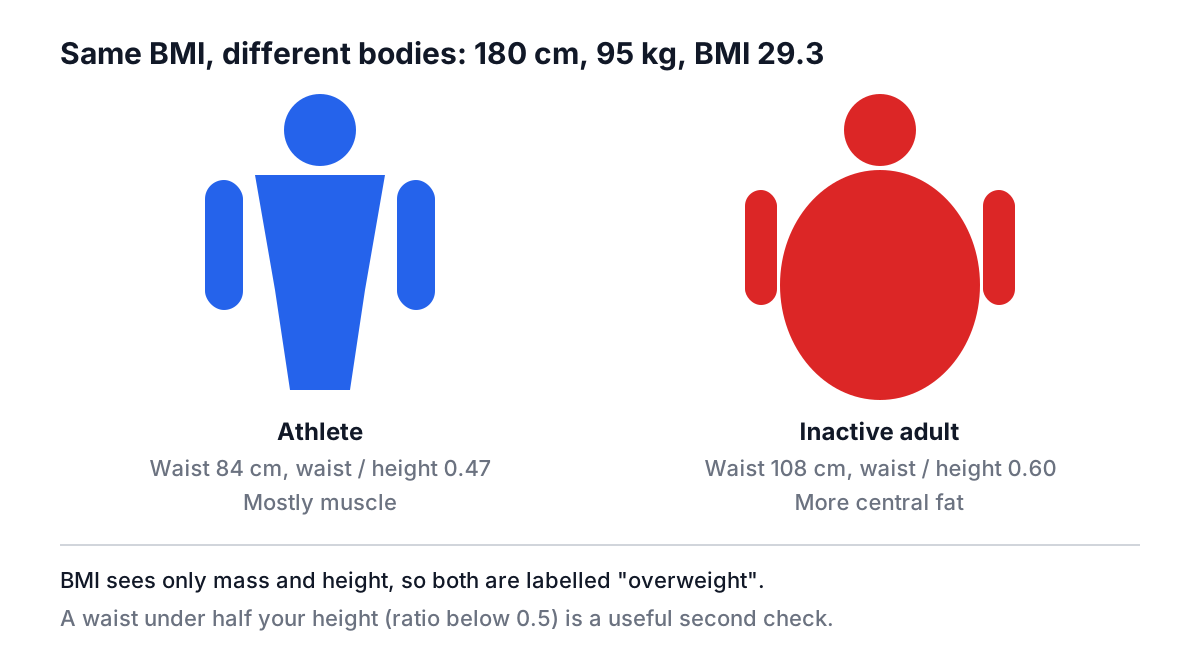
Two people stand on the same scale: both 180 cm, both 95 kg. One plays rugby three times a week and has visible abs. The other has not exercised in a decade. Their body mass index is identical, 29.3, and both are labelled "overweight". That single example explains most of what BMI is good at and most of what it gets wrong.
This guide covers the formula in metric and US units, where the category cut-offs came from, why children are measured differently, and the checks worth pairing with BMI. It is general information, not medical advice.
The formula, in both unit systems
BMI is weight divided by height squared:
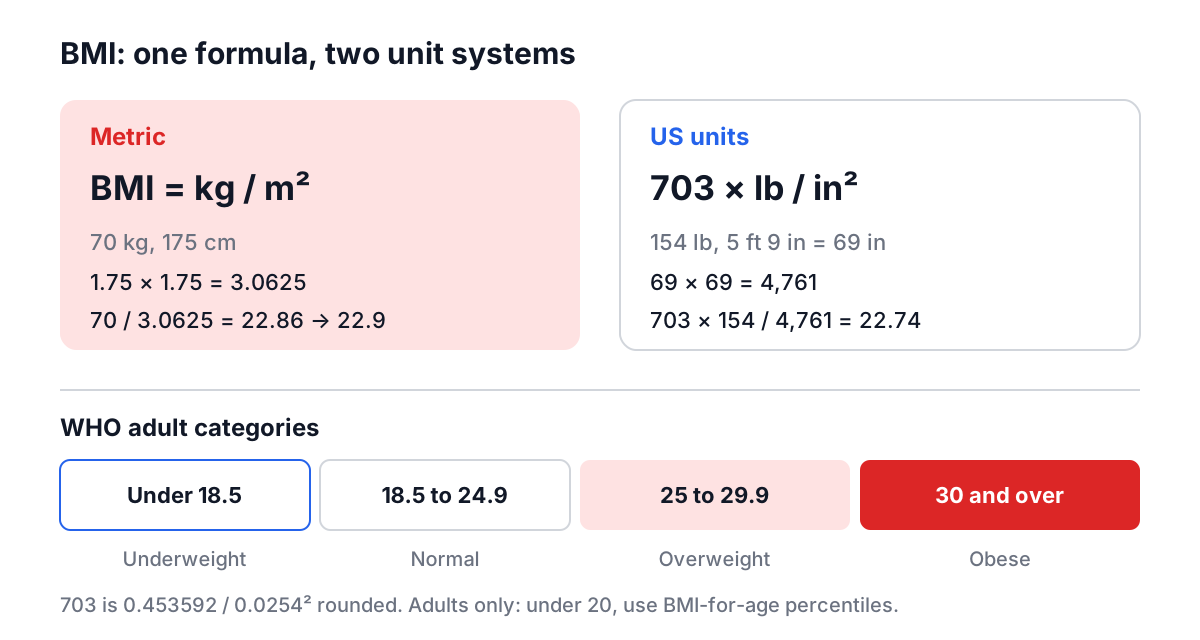
BMI = weight (kg) / height (m)²
For 70 kg and 175 cm: 1.75 × 1.75 = 3.0625, and 70 / 3.0625 = 22.86, usually shown as 22.9.
In pounds and inches the units do not cancel neatly, so a conversion constant appears:
BMI = 703 × weight (lb) / height (in)²
The 703 is the rounded value of 0.453592 / 0.0254² = 703.07. For 154 lb at 5 ft 9 in (69 in): 703 × 154 / 4,761 = 22.74. The BMI Calculator converts pounds and inches to kilograms and metres with the exact factors, so on roughly 3% of inputs it lands 0.1 above a calculator that uses 703. Neither is wrong; the second decimal is noise compared with what you ate yesterday.
Squaring height is a choice, not a law of nature. Adolphe Quetelet, the Belgian statistician who proposed the ratio in the 1830s, found that adult weight scaled roughly with height squared across the populations he measured. In 1972 Ancel Keys compared several weight-height indices against body fat measurements and found this one tracked fat best, and gave it the name body mass index. Because real bodies scale closer to height to the power 2.5, very tall people tend to get slightly higher BMIs and very short people slightly lower ones than their body fat would suggest.
The categories and where they came from
The World Health Organization adult classification, set out in its 2000 technical report on obesity, is:
| BMI | Category |
|---|---|
| Below 18.5 | Underweight |
| 18.5 to 24.9 | Normal weight |
| 25.0 to 29.9 | Overweight (pre-obese) |
| 30.0 to 34.9 | Obesity class I |
| 35.0 to 39.9 | Obesity class II |
| 40 and above | Obesity class III |
The boundaries are round numbers chosen from population studies where risk of conditions such as type 2 diabetes, high blood pressure and cardiovascular disease starts to climb. They are not points where something biological switches on. A BMI of 24.9 and one of 25.1 carry essentially the same risk.
The US National Institutes of Health aligned its guidelines with these WHO cut-offs in 1998, lowering its own overweight threshold. Nobody's body changed that year, but millions of people were reclassified. It is a useful reminder that categories are policy decisions built on top of a continuous measurement.
Lower cut-offs for some groups
A 2004 WHO expert consultation published in The Lancet found that many Asian populations have higher body fat and higher diabetes risk at the same BMI as European populations. It suggested public health action points of 23 and 27.5 for those groups. The UK NICE guidance uses 23 as the overweight threshold and 27.5 as the obesity threshold for people of South Asian, Chinese, other Asian, Middle Eastern, Black African and African-Caribbean family background. If that applies to you, a "normal" 24 on the standard scale deserves a second look.
Children and teenagers use percentiles
The adult table does not apply to anyone still growing. Body fat changes with age and differs between boys and girls through puberty, so a 10-year-old with a BMI of 20 and an adult with a BMI of 20 mean very different things.
For ages 2 to 19 the CDC calculates BMI the same way, then plots it on a sex-specific BMI-for-age growth chart:
| Percentile for age and sex | Category |
|---|---|
| Below 5th | Underweight |
| 5th to below 85th | Healthy weight |
| 85th to below 95th | Overweight |
| 95th and above | Obesity |
Outside the US, the WHO growth references play the same role. The BMI Calculator shows the adult category only, so for a child use the number it gives with a growth chart, or ask a paediatrician.
What BMI cannot see
BMI knows two things: total mass and height. Everything else is invisible to it.
Muscle versus fat. Muscle is denser than fat, and strength athletes routinely score 27 to 30 with low body fat. The reverse problem is more common and more dangerous: an older adult who has lost muscle can have a normal BMI while carrying a high proportion of fat, sometimes called normal-weight obesity.
Where fat sits. Fat around the organs is linked to metabolic disease far more strongly than fat on the hips and thighs. Two people with the same BMI can have very different waistlines.
Pregnancy. Weight gain in pregnancy is expected and BMI is not meaningful during it. Guidelines use pre-pregnancy BMI to suggest a range for gain.
Health itself. Blood pressure, blood glucose, cholesterol, fitness and smoking all matter more to an individual's risk than one BMI reading.
Better checks to pair with BMI
The cheapest and most useful partner is a tape measure. Waist-to-height ratio divides your waist circumference by your height in the same units. A ratio below 0.5 ("keep your waist to less than half your height") is the threshold NICE adopted in 2022 as a sign of healthy central fat. For a 175 cm person that means a waist under 87.5 cm.
Other options, in rough order of cost:
- Waist circumference alone. Common risk flags are above 94 cm for men and 80 cm for women in European populations.
- Bioelectrical impedance scales. Convenient but swing a lot with hydration; use them for trends only.
- Skinfold calipers in trained hands.
- DEXA scans, which measure fat, lean mass and bone directly.
A worked example and common mistakes
Take a 40-year-old who is 168 cm and 79 kg. BMI is 79 / 1.68² = 79 / 2.8224 = 28.0, overweight. Her waist is 92 cm, giving a waist-to-height ratio of 92 / 168 = 0.55. Both measures point the same way, which makes the reading more meaningful than either alone. If she lost 8 kg her BMI would be 25.2, still technically overweight, but the waist measurement would likely have dropped below 84 cm and the ratio below 0.5. That is a real improvement the BMI category hides.
Mistakes that come up often:
- Using the adult table for teenagers. Always use a BMI-for-age chart under 20.
- Treating the boundary as a cliff. 24.9 and 25.0 are the same risk. Look at the trend over months.
- Forgetting that height shrinks. Adults can lose 2 to 4 cm of height with age, which nudges BMI up. Re-measure height occasionally.
- Mixing units. Feet and inches entered as 5.9 instead of 5 ft 9 in gives a wrong height. Enter feet and inches in their own boxes.
- Weighing at random times. Morning weight after the bathroom is the most repeatable.
Where to go next
BMI tells you roughly where you stand; it does not tell you what to eat. If the number prompts a change, the Calorie Calculator estimates your maintenance intake, the Calorie Deficit Planner turns a goal weight into a daily target, and the protein guide explains why protein matters while you lose weight. Measure your waist the same day you check BMI, write both down, and compare them again in three months. The trend in those two numbers is worth more than any single reading.