
EV vs Gas: Running Cost, Break-Even and CO2 Compared
Cost per mile for electric and gasoline cars, how home versus public charging changes the answer, how long a higher EV price takes to pay back, and grid CO2 by region.
· 10 min read
Whether an electric car saves money is not a matter of opinion; it is arithmetic with five inputs that change from driver to driver: how far you drive, what you pay for fuel, what you pay for electricity, where you charge, and how much more the EV costs to buy. This guide works through each one with 2026 US prices, shows where the break-even point comes from, and explains why the same car can be a clear win for one household and a poor deal for another. The EV vs Gas Cost Calculator runs the same comparison with your own numbers.
Cost per mile: the core comparison
Start with energy cost per mile.
For a gas car: price per gallon / miles per gallon. At $3.90 a gallon, which is the US Energy Information Administration's October 2026 forecast for the 2026 average price of regular gasoline, a 30 mpg car costs 3.90 / 30 = 13.0 cents a mile.
For an EV: price per kWh x kWh per mile. A typical efficient EV uses about 30 kWh per 100 miles on the EPA label, or 0.30 kWh a mile. At 18 cents per kWh, close to the EIA's 2026 forecast for the average US residential price, that is 0.18 x 0.30 = 5.4 cents a mile.
The EPA label figure for EVs is measured from the wall socket, so it already includes the energy lost while charging. If you read consumption off the car's own trip computer, which measures from the battery, add about 10%.
Where you charge changes everything
The 5.4 cents assumes home charging. Public DC fast chargers typically charge two to three times the home rate, and the price varies a lot by network and state. The calculator takes the share of charging done at home and blends the two prices:
blended price = home share x home price + public share x public price
With 80% at home at $0.18 and 20% in public at $0.48, the blended price is 0.8 x 0.18 + 0.2 x 0.48 = $0.24 per kWh, or 7.2 cents a mile at 30 kWh per 100 miles.
| Charging pattern | Price per kWh | Cents per mile | Yearly electricity, 12,000 mi |
|---|---|---|---|
| 100% home at $0.18 | $0.18 | 5.4 | $648 |
| 80% home, 20% public at $0.48 | $0.24 | 7.2 | $864 |
| 50% home, 50% public | $0.33 | 9.9 | $1,188 |
| 100% public at $0.48 | $0.48 | 14.4 | $1,728 |
| Gas car, 30 mpg at $3.90 | 13.0 | $1,560 |
A driver with no home charger who relies entirely on fast chargers at 48 cents pays more per mile for electricity than a 30 mpg gas car costs in fuel. Home charging, or cheap workplace charging, is where most of the saving comes from.
Maintenance
EVs have no engine oil, spark plugs, timing belt, exhaust system or transmission fluid changes, and regenerative braking spares the brake pads. Argonne National Laboratory's 2021 total cost of ownership study, summarised by the Department of Energy in its Fact of the Week #1190, estimated scheduled maintenance at 10.1 cents per mile for a conventional car and 6.1 cents for a battery electric vehicle.
Over 12,000 miles a year that is $1,212 against $732, a difference of $480. Tyres can wear somewhat faster on a heavier EV, and out-of-warranty battery repairs are expensive but rare; the Argonne figures are averages over the vehicle's life.
Putting it together: the yearly saving
With the calculator's US defaults:
| Item | Gas car | EV |
|---|---|---|
| Energy | 400 gal x $3.90 = $1,560 | 3,600 kWh x $0.24 = $864 |
| Maintenance | 12,000 x $0.101 = $1,212 | 12,000 x $0.061 = $732 |
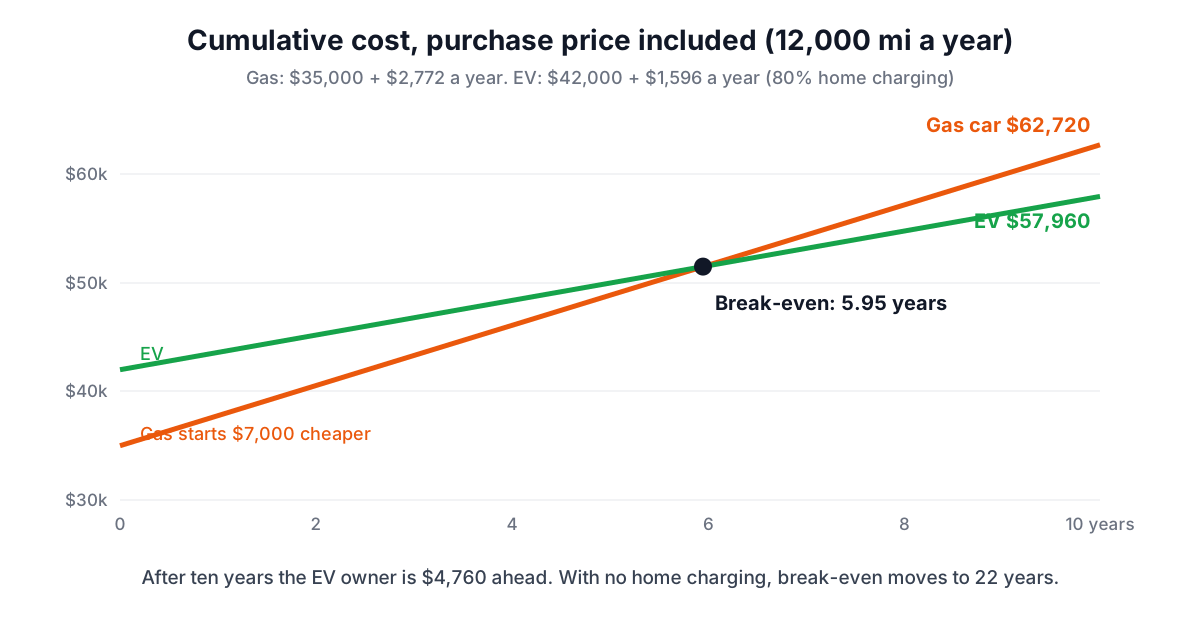
| Total per year | $2,772 | $1,596 |
| Per mile | 23.1 cents | 13.3 cents |
The EV saves $1,176 a year.
Break-even: paying back the higher price
If the EV costs more up front, the yearly saving has to pay that back.
break-even years = (EV price - incentives - gas car price) / yearly saving
With a $42,000 EV, a $35,000 gas car and no incentives, the gap is $7,000. $7,000 / $1,176 = 5.95 years. After ten years the EV owner is $4,760 ahead.
The table below shows how sensitive that is to the inputs. Each row changes one thing from the default.
| Change from the default | Yearly saving | Break-even |
|---|---|---|
| Default (12,000 mi, 80% home charging) | $1,176 | 5.95 years |
| No home charging (100% public) | $312 | 22.4 years |
| 20,000 miles a year | $1,960 | 3.6 years |
| 6,000 miles a year | $588 | 11.9 years |
| $2,000 state rebate | $1,176 | 4.25 years |
Two things stand out. Mileage scales the saving directly, so a high-mileage commuter breaks even much sooner. And the charging pattern can turn a six-year payback into a twenty-year one.
Incentives in 2026
Incentives used to shorten the payback a lot. The federal new clean vehicle credit under section 30D ended for vehicles acquired after 30 September 2025, under the One Big Beautiful Bill Act. Some states, utilities and employers still offer rebates for EVs or home chargers, so check what applies to you and enter it in the incentives field. The calculator defaults it to zero.
What about outside the US?
The same arithmetic works anywhere; only the inputs change. Switch the calculator to metric and it uses litres per 100 km and kWh per 100 km. A driver covering 20,000 km a year in a car using 7 L/100 km at 1.75 a litre, against an EV using 18 kWh/100 km charged 80% at home at 0.25 and 20% in public at 0.60, saves about 1,800 a year and recovers a 7,000 price gap in 3.9 years. High fuel prices make the case stronger.
CO₂: tailpipe against power station
Burning a gallon of gasoline releases 8.78 kg of CO₂, according to the EPA GHG Emission Factors Hub 2025. The default gas car burns 400 gallons a year, which is 3.51 tonnes.
An EV's emissions depend on the grid. On the US average from EPA's eGRID2023, 0.352 kg CO₂e per kWh, the default EV's 3,600 kWh produce 1.27 tonnes. In California the same driving gives 0.72 tonnes; on the highest-emitting subregions (Hawaii and Puerto Rico) it reaches about 2.5 tonnes, still below the gas car. On the UK grid at 0.177 kg per kWh, the metric example above emits 0.64 tonnes against 3.25 tonnes for the petrol car.
These are use-phase figures. Making an EV battery adds emissions up front, which the yearly saving then pays back over time, and neither side includes the emissions of producing the fuel or the electricity. For the whole household picture, see how to calculate your carbon footprint.
What the comparison leaves out
The calculator compares the costs that differ most between powertrains. It does not model:
- Insurance, which can be higher for some EVs; add a yearly difference to the maintenance figure if your quotes differ.
- Depreciation and resale value, which vary by model more than by powertrain. If you expect one car to hold its value better, reduce its purchase price by the difference.
- Financing: if you borrow, interest on the higher EV price adds to the gap. The Auto Loan Calculator shows the interest.
- Home charger installation, typically a one-off cost; add it to the EV price.
- Price changes: fuel and electricity prices both move, and the result scales with the gap between them.
Checklist before you decide
- Use your real yearly mileage from service records or the odometer.
- Look up your electricity rate, including any EV or time-of-use tariff for overnight charging.
- Estimate honestly how much you will charge at home.
- Get real purchase quotes for both cars, including any rebates.
- Run the numbers in the EV vs Gas Cost Calculator, then check charging times for your routine with the EV Charging Calculator and our guide on how long an EV takes to charge.
Sources
- US Energy Information Administration, Short-Term Energy Outlook, October 2026: 2026 forecast averages for regular gasoline and residential electricity prices.
- US Department of Energy, Vehicle Technologies Office, Fact of the Week #1190 (June 2021), summarising Burnham A. et al., "Comprehensive Total Cost of Ownership Quantification for Vehicles with Different Size Classes and Powertrains", Argonne National Laboratory (2021).
- US EPA, GHG Emission Factors Hub (January 2025): mobile combustion CO₂ factors and eGRID2023 electricity emission rates.
- UK Department for Energy Security and Net Zero, Greenhouse gas reporting: conversion factors 2025 (UK electricity).
- One Big Beautiful Bill Act (Public Law 119-21, 2025): termination of the section 30D clean vehicle credit for vehicles acquired after 30 September 2025.
Related searches
- ev vs gas cost per mile
- is an electric car cheaper to run
- ev break even years
- cost to charge vs fill up
- ev maintenance cost per mile
- ev co2 vs gasoline car
- public charging vs home charging cost
- electric car savings per year