
How Long Does an EV Take to Charge? Level 1, Level 2 and DC
Charging time from kWh and kW, why the car's onboard charger can be the limit, why fast charging slows after half full, and what a charge really costs.
· 10 min read
"How long does it take to charge?" has no single answer for an electric car, because it depends on four things: how much energy the battery needs, how much power the charger can supply, how much power the car will accept, and how full the battery already is. Once you know those, the arithmetic is simple. This guide explains each factor, works through home and road-trip examples, and covers what a charge actually costs. The EV Charging Time and Cost Calculator does the same calculation for any car and charger.
The basic formula
Charging time is energy divided by power.
energy needed = usable battery capacity x (target % - start %)
time = energy needed / (charging power x efficiency)
Take a car with a 75 kWh usable battery charging from 20% to 80%. It needs 75 x 0.6 = 45 kWh in the battery. On a 7.68 kW home charger with 90% of the wall power reaching the battery, the time is 45 / (7.68 x 0.9) = 6.5 hours, or 6 hours 31 minutes.
Use the usable capacity, not the gross figure. Manufacturers keep a buffer at the top and bottom of the battery, and some quote the larger number.
Where charger power comes from
For AC charging (Level 1 and Level 2 in North America, wallboxes elsewhere), power is volts times amps.
A Level 1 charger plugs into a standard 120 V outlet and draws 12 A, giving 120 x 12 = 1.44 kW. A Level 2 charger runs on 240 V. The common home installation is a 40 A circuit, but because the US National Electrical Code (Article 625) treats EV charging as a continuous load, the charger may draw only 80% of the circuit rating: 32 A, or 240 x 32 = 7.68 kW. A 60 A circuit allows 48 A, or 11.52 kW. Public Level 2 chargers in commercial buildings often run at 208 V, so a 30 A unit delivers 6.24 kW.
In Europe and much of the world, single-phase wallboxes run at 230 V (3.7 kW at 16 A, 7.4 kW at 32 A), and three-phase units deliver 11 kW at 16 A or 22 kW at 32 A.
DC fast chargers bypass the car's onboard charger and feed the battery directly. They are rated in kilowatts: 50, 150, 250 and 350 kW are common.
The car's own limits
The charger's rating is only half the story.
On AC, the car converts AC to DC with an onboard charger, and that sets a ceiling. Many cars accept 11 kW; some accept only 7.2 kW and a few up to 19.2 or 22 kW. A 22 kW wallbox on a car with an 11 kW onboard charger charges at 11 kW. In the calculator's table below, the 11 kW and 22 kW wallboxes give exactly the same time for a car limited to 11 kW.
On DC, every car has a peak charging rate, and it only holds that peak while the battery is relatively empty. As the cells fill, their voltage rises and the car reduces current to protect them. This is the charging curve, and it is why the last part of a charge is slow.
Charging time on every charger
Here is the same session, a 75 kWh battery from 20% to 80%, for a car with an 11 kW onboard charger and a 170 kW DC peak, as the calculator computes it. Range assumes 30 kWh per 100 miles from the wall.
| Charger | Power | Time | Miles added per hour |
|---|---|---|---|
| Level 1, 120 V 12 A | 1.44 kW | 36 h 46 min | 4.8 |
| Level 1, 120 V 16 A | 1.92 kW | 27 h 34 min | 6.4 |
| Level 2, 240 V 16 A | 3.84 kW | 13 h 1 min | 12.8 |
| Public Level 2, 208 V 30 A | 6.24 kW | 8 h 1 min | 20.8 |
| Level 2, 240 V 32 A | 7.68 kW | 6 h 31 min | 25.6 |
| Level 2, 240 V 40 A | 9.6 kW | 5 h 13 min | 32.0 |
| Level 2, 240 V 48 A | 11.52 kW (car limits to 11) | 4 h 33 min | 36.7 |
| Wallbox 22 kW three-phase | 22 kW (car limits to 11) | 4 h 33 min | 36.7 |
| DC fast 50 kW | 50 kW | 58 min | |
| DC fast 150 kW | 150 kW | 22 min | |
| DC fast 250 kW | 250 kW (car peaks at 170) | 20 min |
Two patterns stand out. Above the car's onboard limit, a faster AC charger buys nothing. And on DC, going from 150 kW to 250 kW or 350 kW barely helps a car whose own peak is 170 kW.
Why fast charging slows down after 80%
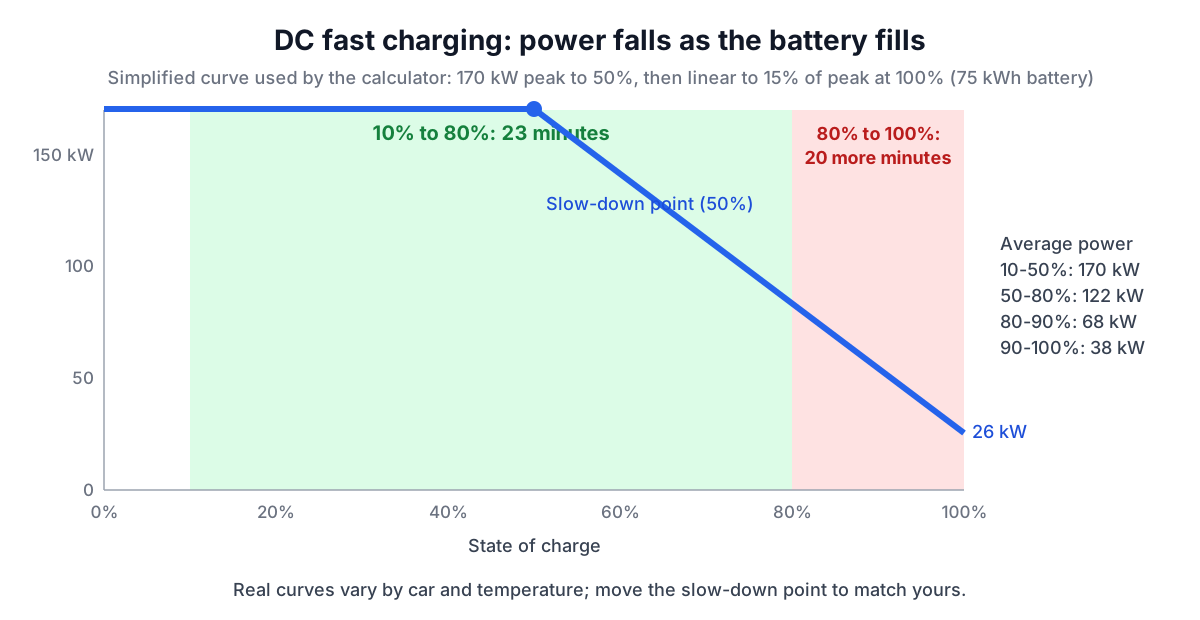
Real charging curves vary by model, battery chemistry and temperature, and they are rarely published in detail. The calculator uses a deliberately simple model: the car holds its peak DC power up to a slow-down point (50% by default, adjustable) and then power falls in a straight line to 15% of the peak at 100%. The charger's own rating caps the power throughout.
Even this simple model shows why road-trip advice says stop at 80%. For the 170 kW car on a 250 kW charger:
| Window | Energy into battery | Time | Average power |
|---|---|---|---|
| 10% to 50% | 30 kWh | 11.4 min | 170 kW |
| 50% to 80% | 22.5 kWh | 11.9 min | 122 kW |
| 80% to 90% | 7.5 kWh | 7.1 min | 68 kW |
| 90% to 100% | 7.5 kWh | 12.7 min | 38 kW |
From 10% to 80% takes about 23 minutes. Going on to 100% takes another 20 minutes for less than a third as much energy. On a trip it is usually quicker to stop twice for short sessions than once for a long one. If you know your car's real curve, move the slow-down point in the calculator to match; cold batteries also charge more slowly until they warm up, which is why many cars precondition the battery when you navigate to a fast charger.
Charging losses
Not all the energy from the wall reaches the battery. Some is lost as heat in the onboard charger, the cable and the battery itself, and the car's electronics and battery heating draw power while it charges. Losses vary with power, temperature and car; slow Level 1 charging tends to lose a larger share because the car's systems stay awake for many hours.
The calculator uses editable defaults of 85% efficiency for Level 1, 90% for Level 2 and 93% for DC. In the Level 2 example, 50 kWh comes from the wall to put 45 kWh in the battery: 5 kWh is lost. If you have measured your own losses with a smart charger or meter, enter your figure.
What a charge costs
Cost is the energy you pay for times the price, plus any fees.
At home your meter records wall energy, so you pay for losses. The Level 2 example draws 50 kWh; at 18 cents per kWh, close to the US Energy Information Administration's 2026 forecast for average residential electricity, that is $9.00, or 20 cents per kWh actually stored. At 30 kWh per 100 miles, that charge adds about 167 miles, roughly 5.4 cents a mile.
Public networks price in different ways:
- Per kWh: the most common. Many networks meter the energy their charger delivers, so if your network bills its own kWh reading, set efficiency close to 100% in the calculator.
- Session fees: a fixed charge per plug-in.
- Per minute: some networks, and some states where per-kWh selling was historically restricted, bill by time, sometimes in power tiers. At 35 cents a minute, the 23 minute DC session above would cost about $8.17 regardless of how much energy it delivered, which makes a slow-charging car expensive.
- Idle fees for staying plugged in after the charge completes.
The DC session from 10% to 80% at 48 cents per kWh comes to $27.10, or about 51.6 cents per kWh stored, almost three times the home cost. That gap is the reason home charging decides whether an EV saves money; see EV vs gas running costs.
Choosing a home charger
- Check your car's onboard AC limit. There is no point paying for a 48 A circuit if the car accepts 7.2 kW.
- Work out your daily need. At 12,000 miles a year you need about 33 miles a day. A 7.68 kW Level 2 adds about 25 miles an hour, so an hour and a half each night covers it. Even Level 1 adds 40 to 50 miles over a 10 hour night.
- Check your panel capacity. A 40 A or 60 A circuit is a big load; an electrician should check the service and size the wire. The Wire Size Calculator shows how conductor size depends on current and distance.
- Look for an EV or time-of-use tariff. Shifting charging to overnight off-peak rates can cut the cost per mile substantially.
If you have solar panels, daytime charging uses power that would otherwise be exported at a lower rate; the Solar Payback Calculator and our guide to solar payback cover how that improves the economics.
Sources
- National Fire Protection Association, NFPA 70 National Electrical Code, Article 625 (electric vehicle power transfer systems): EV supply equipment as a continuous load, rated at 125% of the load current.
- US Energy Information Administration, Short-Term Energy Outlook, October 2026: 2026 forecast average residential electricity price.
- US Department of Energy, Alternative Fuels Data Center, "Charging Electric Vehicles at Home" and "Developing Infrastructure to Charge Electric Vehicles": Level 1, Level 2 and DC fast charging definitions.
- US EPA and DOE, fueleconomy.gov: EV consumption in kWh per 100 miles, measured from the wall.
- Worked examples computed with the RedBison EV Charging Time and Cost Calculator.
Related searches
- how long to charge an electric car
- level 2 charging time 240v 32a
- level 1 charger miles per hour
- why does ev charging slow down at 80
- cost to charge an ev at home
- onboard charger limit 11 kw
- dc fast charging 10 to 80 time
- ev charging losses percent