
Your Life in Weeks: The Grid, the Maths and How to Use It
Where Tim Urban's life-in-weeks chart came from, why a year is 52.18 weeks and not 52, how to count the weeks you have lived, and what to do with the picture.
· 5 min read
Print a 90-year human life at one box per week and it fits on a single sheet of paper: 90 rows of 52 boxes, 4,680 in all. That sheet is the whole idea behind the life-in-weeks chart, and it lands harder than any number does. Saying "I am 36" is abstract. Seeing 36 full rows, with a 37th part-filled, is not.
This guide covers where the chart comes from, the arithmetic behind it (which is slightly trickier than "multiply by 52"), how to read your own grid in the Life in Weeks Calculator, and some practical ways people use the picture once they have it.
Where the chart comes from
The modern version is Tim Urban's. In May 2014 he published "Your Life in Weeks" on his blog Wait But Why, with a poster-style grid of 90 rows and 52 columns, one row per year of life. He followed it with posts on the same theme in months and years, and the week grid has since been copied into wall posters, journals and apps.
The idea underneath is much older. Stoic writers kept death in view on purpose, a practice later summed up as memento mori; Seneca's essay On the Shortness of Life argues that life is long enough if you use it well. The chart simply turns that argument into something you can count.
The arithmetic: 52 or 52.18 weeks a year?
A year is not 52 weeks. A common year has 365 days, which is 52 weeks and 1 day; a leap year has 366 days, 52 weeks and 2 days. Averaged over the 400-year Gregorian cycle, a year is 365.2425 days, which is 52.1775 weeks.
That 0.18 adds up. Over 80 years it is about 14 extra weeks:
| Lifespan | Grid boxes (52 per year) | Calendar weeks (52.1775 per year) | Difference |
|---|---|---|---|
| 70 years | 3,640 | 3,652 | 12 |
| 80 years | 4,160 | 4,174 | 14 |
| 90 years | 4,680 | 4,696 | 16 |
So there are two honest ways to count, and the calculator uses both for different jobs.
Weeks lived is the number of full 7-day periods since your birth: days lived divided by 7, rounded down. This is what you would get by counting on a calendar, and leap days are included automatically because it starts from actual dates.
The grid keeps Urban's layout of exactly 52 boxes per row, because a row that means "one year of my life" is the point of the picture. To keep the rows honest, the calculator fills one full row per birthday you have had, then fills the current row with the full weeks since your last birthday (at most 51).
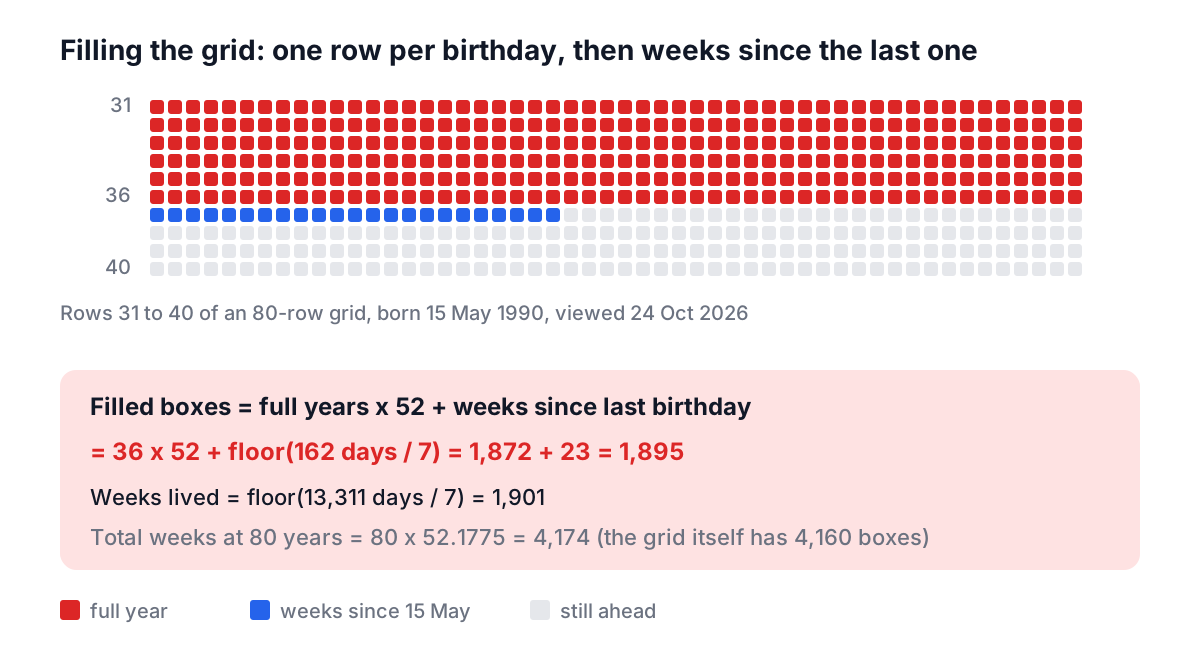
Why not just fill the first N boxes, where N is weeks lived? Because the error compounds. A person on their 40th birthday has lived 14,610 days, which is 2,087 weeks. Fill 2,087 boxes in rows of 52 and you land seven boxes into the 41st row, as if they were already seven weeks into their 41st year. Filling by birthday puts them at the start of row 41, which is where they actually are.
A worked example
Take someone born on 15 May 1990, using the calculator on 24 October 2026 with a life expectancy of 80:
- Enter 1990-05-15 in Date of birth and 80 in Life expectancy, then press Visualize.
- Calendar age is 36, because the 36th birthday was on 15 May 2026.
- Days lived: 13,311. Weeks lived: 13,311 / 7 = 1,901.6, so 1,901 full weeks.
- Expected total: 80 x 52.1775 = 4,174.2, so 4,174 weeks. Weeks remaining: 4,174 - 1,901 = 2,273.
- Percentage completed: 1,901 / 4,174 = 45.5%.
- The grid fills 36 rows (36 x 52 = 1,872 boxes) plus 23 boxes in row 37, because 162 days have passed since the May birthday and 162 / 7 = 23.1. That is 1,895 boxes of 4,160.
If you enter an age instead of a birth date, the calculator assumes today is your birthday. The age-only figures can therefore be up to 51 weeks out; use the date when you know it.
Choosing a life expectancy
The calculator defaults to 80 and accepts anything from 1 to 120. Treat it as a planning horizon, not a forecast. National averages at birth are mostly in the 70s and 80s, and once you have reached middle age your own expected remaining years are higher than the at-birth figure suggests, because you have already survived the risks of the earlier decades. Many people simply pick 90 to match Urban's chart. Whatever you choose, the lived part of the grid does not change; only the empty part does.
Weeks, months or years
The settings button switches the grid between three units:
- Weeks: 52 per row, about 4,000 boxes. The most striking view, and the one that makes a single week feel small.
- Months: 12 per row, 960 boxes for 80 years. Good for seeing seasons of life, such as a degree or a job.
- Years: 10 per row, so each row is a decade. Useful for long-range plans.
The summary cards follow the unit you pick, so "months remaining" counts calendar months, not weeks divided by four.
What people do with it
The chart is only useful if it changes a decision. Some uses that work:
- Count the weeks that matter for a specific goal. If your child is 12, there are roughly 313 weeks until they turn 18. That number tends to reshape how weekends get spent.
- Mark chapters. Some people print the grid and shade school, jobs and moves in different colours. Gaps and long single-colour stretches stand out.
- Review one row a year. On your birthday, look at the row you just finished. What do you want the next 52 boxes to hold?
- Plan backwards. Use the Date Difference Calculator to count weeks between today and a target date, or Date Arithmetic to find the date 500 weeks from now.
Common mistakes
- Using 52 weeks per year for totals. It understates an 80-year life by 14 weeks. Small, but it is the kind of error that makes two calculators disagree.
- Using 365.25 days per year for age. Dividing days by 365.25 and rounding down can make someone a year younger on their birthday; 1,095 days after 1 January 2001 is 1 January 2004, a third birthday, yet 1,095 / 365.25 is 2.998. Calendar age avoids this.
- Reading the grid as a countdown. The empty boxes are a guess. The filled ones are the only certain part, and they are the ones worth looking at.
If the grid feels heavy, switch to the years view or close it and come back on your next birthday. For a gentler daily practice alongside it, the wellness habits guide covers small routines that fit into an ordinary week, and the Mental Wellness Worksheet is a place to write down what you want the next row to hold.