
LTV:CAC and CAC Payback: Unit Economics With Real Numbers
How to calculate LTV from churn and gross margin, fully loaded CAC, the 3:1 rule and CAC payback months, with worked SaaS and e-commerce examples and the usual traps.
· 7 min read
A startup can grow fast and still lose money on every customer it signs. Revenue goes up, the bank balance goes down faster, and nobody notices until the next fundraise. Two numbers catch this early: how much gross profit a customer brings in over the relationship (LTV), and how much it cost to win them (CAC). Divide one by the other, add how many months it takes to earn the CAC back, and you have the core of what investors call unit economics.
This guide works through the formulas with real arithmetic, shows where the common shortcuts go wrong, and explains how to read the results in the LTV-CAC Calculator.
The four numbers
| Metric | Formula | Unit |
|---|---|---|
| LTV (subscription) | ARPA x gross margin / churn | currency |
| LTV (order-based) | order value x orders per year x years x gross margin | currency |
| CAC | sales and marketing spend / new customers, same period | currency |
| LTV:CAC | LTV / CAC | ratio |
| CAC payback | CAC / (monthly ARPA x gross margin) | months |
ARPA is average revenue per account. Churn is the share of customers who cancel in a period. Every figure has to use the same period: monthly ARPA with monthly churn, or annual with annual.
Why LTV uses churn and gross margin
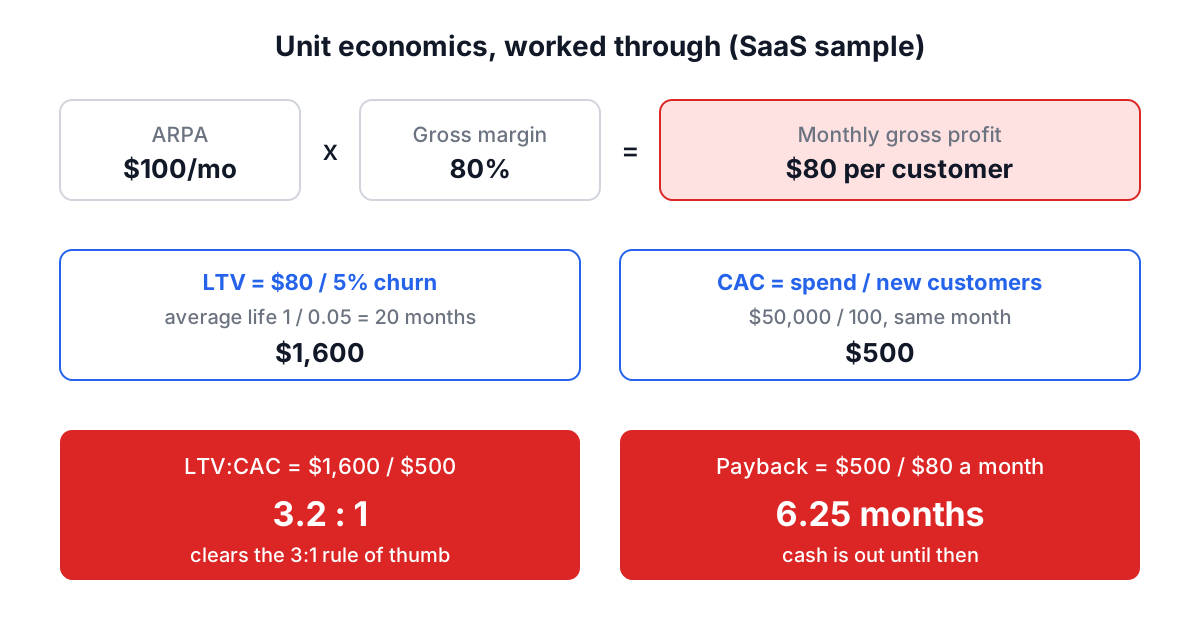
If 5% of customers cancel every month and that rate stays constant, the average customer stays 1 / 0.05 = 20 months. That is where ARPA / churn comes from: $100 a month for 20 months is $2,000 of revenue.
Revenue is the wrong thing to compare with CAC, though. If hosting, support and payment fees take 20% of each dollar, the customer leaves you $80 a month, and that $80 is what repays acquisition. So LTV = $100 x 0.8 / 0.05 = $1,600.
Two traps sit in this formula:
- Mixing periods. Annual churn of 40% is not 3.3% a month. The monthly equivalent is 1 - (1 - 0.40)^(1/12), about 4.2%. Dividing annual churn by 12 understates churn and inflates LTV.
- Zero churn. With no cancellations yet, the formula divides by zero and LTV becomes infinite. That means you lack data, not that customers stay forever. The calculator shows LTV and the ratio as n/a in this case. Try 1 to 2% a month, or wait until you have enough cancellations to measure.
For businesses without subscriptions the calculator's Traditional method multiplies average order value by purchases per year, expected lifespan in years and gross margin. A shop with $75 orders, four a year, a two-year lifespan and 40% margin has an LTV of $240.
Fully loaded CAC
CAC is total sales and marketing cost for a period divided by the customers won in that period. "Total" is where it usually goes wrong. Paid ads are only part of it. Include:
- ad spend and sponsorships
- salaries, commissions and contractor fees for sales and marketing staff
- tools such as the CRM, email platform and analytics
- events, content production and agency retainers
Do not include customer success work on existing accounts; that belongs in gross margin or operating cost. Match the period, too: spend from the third quarter divided by customers won in the third quarter. If deals take three months to close, a growing company will see CAC look better than it is, because this quarter's customers came from last quarter's smaller spend.
Reading the ratio and payback together
The LTV:CAC ratio says whether a customer is worth acquiring. Around 3:1 is the common rule of thumb in SaaS. The calculator labels below 2:1 as critical, 2:1 to 3:1 as a warning and 3:1 or more as healthy. A ratio far above 5:1 often means you could spend more on growth.
Payback says how long your cash is tied up: CAC divided by the gross profit a customer produces each month. It matters because LTV is a forecast spread over years and payback is cash you need now.
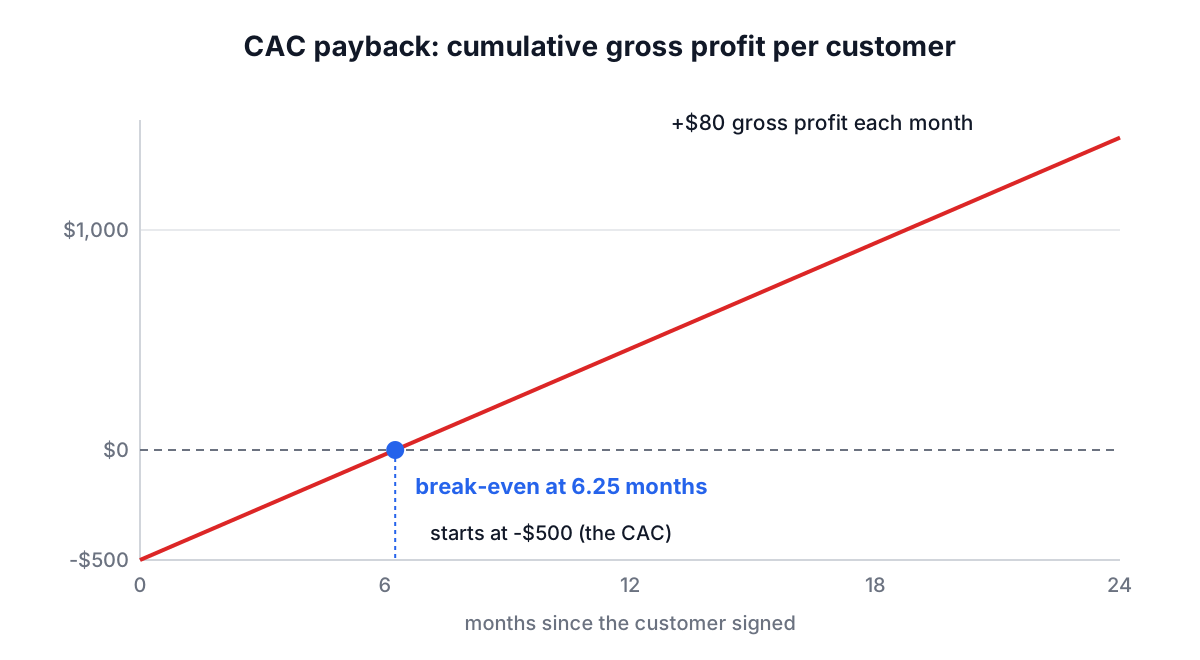
Two companies with the same 3:1 ratio can be very different:
| Company A | Company B | |
|---|---|---|
| Monthly gross profit per customer | $80 | $40 |
| Monthly churn | 5% | 2.5% |
| LTV | $1,600 | $1,600 |
| CAC | $500 | $500 |
| LTV:CAC | 3.2:1 | 3.2:1 |
| Payback | 6.25 months | 12.5 months |
Company B needs twice as much cash to grow at the same pace, because each customer takes twice as long to repay.
Worked examples in the calculator
Open the LTV-CAC Calculator and use the sample buttons:
- SaaS Sample. $100 a month, 5% churn, 80% margin, $50,000 spend for 100 customers. Results: LTV $1,600, CAC $500, ratio 3.20:1, healthy, payback 6.3 months (6.25 rounded).
- E-commerce Sample. $75 orders, 4 a year, 2 years, 40% margin, $25,000 for 500 customers. LTV $240, CAC $50, ratio 4.80:1. Monthly gross profit is $75 x 4 x 0.4 / 12 = $10, so payback is 5.0 months.
- Subscription Sample. $15 a month, 8% churn, 70% margin, $30,000 for 1,000 customers. LTV $131, CAC $30, ratio 4.38:1, payback 2.9 months.
- Marketplace Sample. $200 transactions, 6 a year, 3 years, 25% take rate entered as margin, $75,000 for 300 customers. LTV $900, CAC $250, ratio 3.60:1, payback 10.0 months.
Then change one input at a time. Cutting SaaS churn from 5% to 4% lifts LTV from $1,600 to $2,000 without touching CAC or payback. Raising the price to $120 improves all three. Seeing which lever moves which number is the most useful thing the calculator does.
Common mistakes
- Blended CAC hides bad channels. Free signups from word of mouth make paid channels look cheaper. Run the numbers per channel.
- Revenue LTV. Leaving out gross margin can inflate LTV by a third or more for a typical SaaS company.
- Early churn as gospel. Twenty customers and one cancellation is not a 5% churn rate you can bank on. Show a range.
- Ignoring expansion. If customers upgrade over time, simple ARPA / churn understates LTV. Note it as an assumption rather than baking optimism into the base case.
Putting it to use
Work out CAC per channel, LTV with gross margin and a churn rate you can defend, then read the ratio together with payback. If payback runs past a year, fix that before scaling spend. For the market these customers come from, the market sizing guide and the TAM SAM SOM Calculator cover the other half of the investor conversation, and the Pitch Deck Builder is where both end up.