
TAM, SAM and SOM: Sizing a Market Top-Down and Bottom-Up
What TAM, SAM and SOM really mean, a worked bottom-up example with customer counts and ACV, how to cross-check it top-down, and the mistakes investors spot first.
· 7 min read
Every pitch deck has a market slide, and most of them say the same thing: a research firm thinks the category is worth tens of billions, so capturing 1% would make a large company. Investors have seen that slide hundreds of times and skip past it. The market slide that holds attention is the one where the founder can say how many buyers exist, what each one pays and how many of them the company can realistically reach in the next three to five years.
This guide covers what TAM, SAM and SOM mean, a full bottom-up worked example, how to cross-check it top-down, and the mistakes that make a market size easy to dismiss. The numbers in the example are made up so the arithmetic is easy to follow. Replace them with figures you can source.
TAM, SAM and SOM in one picture
The three terms describe nested markets:
- TAM (total addressable market): annual revenue if every possible buyer of this kind of product bought it at your price, or spent their full category budget.
- SAM (serviceable available market): the part of TAM your product, channels and geography can actually serve today.
- SOM (serviceable obtainable market): the part of SAM you can realistically win in a set time window, given competitors, sales capacity and money.
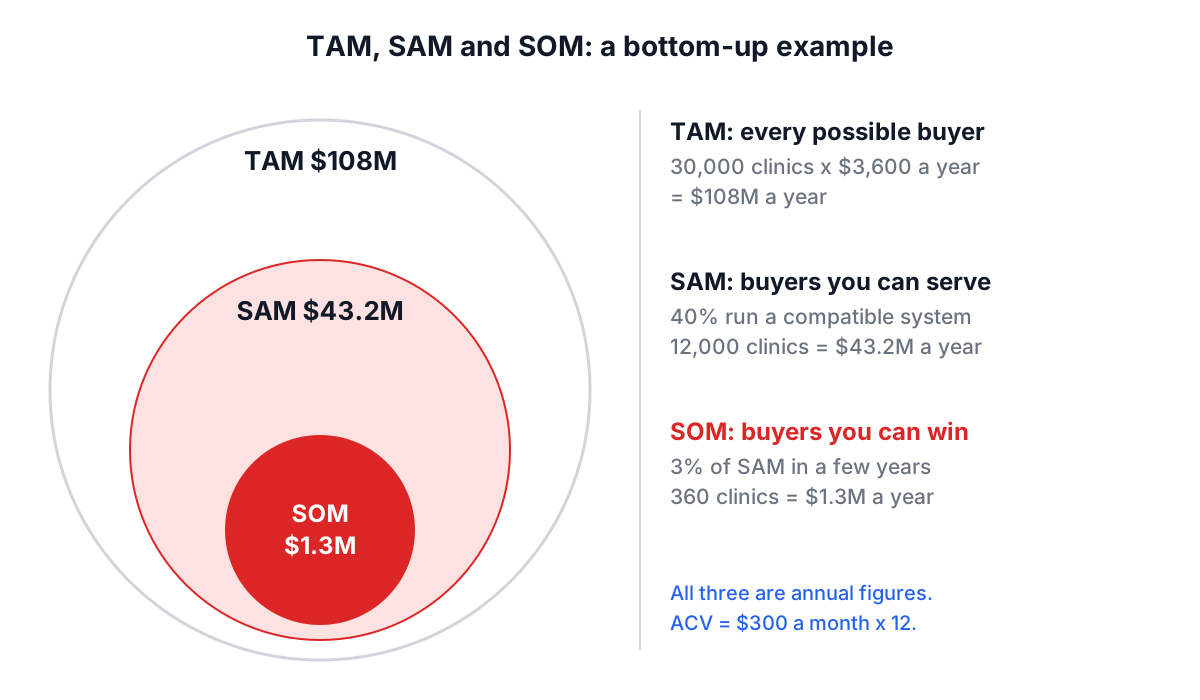
All three are annual figures. If a slide mixes an annual TAM with a five-year cumulative SOM, the ratio between them means nothing.
A bottom-up worked example
Bottom-up sizing counts buyers and multiplies by what each would pay. Suppose you sell a scheduling add-on to veterinary clinics for $300 a month, which is $3,600 a year in annual contract value (ACV).
- Count the buyers. Say an industry association lists 30,000 clinics in the countries you could sell in. That count is the most important input, so cite where it came from.
- TAM = customers x ACV. 30,000 x $3,600 = $108M a year.
- Narrow to SAM. Your add-on only integrates with the practice-management systems used by about 40% of clinics. SAM is 12,000 clinics, or $43.2M.
- Estimate SOM. With two salespeople closing a few clinics a week each, winning 3% of SAM over the next few years (360 clinics) is ambitious but defensible. SOM is about $1.3M a year.
You can reproduce this in the TAM SAM SOM Calculator: choose Bottom-Up (Customer Count), enter 30,000 customers and 3,600 revenue per customer, set SAM Percentage to 40 with Geographic Reach and Business Model Fit at 100, then set Target Market Share to 3 with the other two SOM factors at 100. It shows TAM $108.0M, SAM $43.2M and SOM $1.3M. Its Revenue Projection line is SOM x 0.85, a fixed haircut, so ignore it if you have your own forecast.
The calculator splits SAM and SOM into three factors each because there is usually more than one reason you cannot serve everyone. Use as many as you have real reasons for and leave the rest at 100%. Three factors of 70% look modest one at a time but together cut a number to 34%.
Top-down as a cross-check
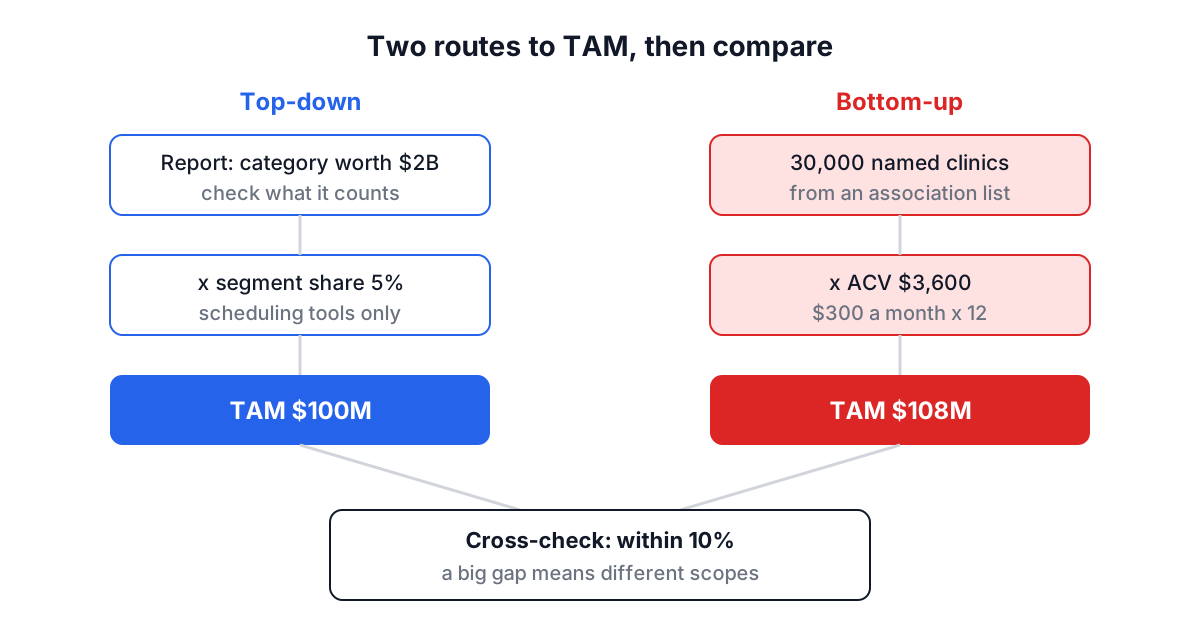
Top-down sizing starts from a published figure and slices it. If an analyst report put veterinary practice software at $2B a year and scheduling tools at about 5% of that, top-down TAM would be $100M. That is close to the $108M bottom-up figure, which is reassuring. If the two had been $108M and $1.5B, one of them would be counting something different and you would need to find out what before presenting either.
| Top-down | Bottom-up | |
|---|---|---|
| Starts from | A research report's market figure | A count of buyers you can name |
| Main input to defend | The report's scope and the segment share | Customer count and ACV |
| Speed | Minutes | Hours to days |
| Typical failure | Category defined more broadly than your product | Optimistic price or a customer count that includes non-buyers |
| Investor trust | Low on its own | Higher, because each input can be checked |
A third approach, value theory, sizes a market by the cost of the problem rather than current spending. It suits new categories with no existing budget line. The TAM SAM SOM Calculator offers it as Value Theory (Problem Size), but both inputs are estimates, so pair it with one of the other two.
Turning SOM into customers and revenue
TAM built from category spend is not the same as revenue at your price. Suppose clinics spend about $12,000 a year each on all practice software, so a category-spend TAM is 30,000 x $12,000 = $360M. The Market Sizing Calculator works from that kind of figure:
- Industry Size $360M, SAM as % of TAM 40%, so SAM is $144M.
- Market Penetration 3% and 5 competitors. The tool discounts penetration by 3 points per competitor (a factor of 0.85 here, never below 0.1), so SOM is $144M x 0.03 x 0.85 = about $3.7M.
- Average Customer Spending $12,000 turns that SOM into about 306 clinics.
- Monthly Pricing $300 gives $3,600 a year each, so Projected Annual Revenue is about $1.1M.
The $3.7M SOM and the $1.1M revenue describe the same clinics. The difference is that your product captures $3,600 of each clinic's $12,000 software budget. Founders who quote the larger number as revenue get caught on this quickly.
Mistakes that sink a market slide
Counting people instead of buyers. "There are 330 million Americans" is not a TAM for a B2B product. Count the organisations or roles that hold the budget.
Using monthly prices for an annual market. 15 million users x $25 is a monthly number. Multiply by 12, or use annual revenue per customer from the start.
The 1% argument. "If we get just 1% of a $50B market" skips every step that matters. SOM should come from capacity and conversion: how many deals your team can close, from how many leads, at what win rate.
Double filtering. If the report already covers only North America, do not apply a separate geographic factor for North America.
No sources. Write where each number came from in Key Assumptions and Data Sources. The calculators save those fields in your browser with the numbers so the reasoning travels with the result.
What to do next
Build the bottom-up version first, because it forces you to know your customer count and price. Run a top-down figure next to it and explain any gap. Then check the unit economics: a large SOM is only worth chasing if each customer is profitable, which the LTV:CAC guide and the LTV-CAC Calculator cover. If you are still choosing between ideas, the startup idea selection guide shows how market size fits alongside other criteria, and the Lean Canvas guide shows where customer segments and revenue streams sit on one page.