
How Much Do You Need to Retire? Building the Number Step by Step
Turn today's spending into a retirement target: inflation, income ratio, guaranteed income, one-off goals, and the assumptions that move the answer most.
· 6 min read

A 30-year-old spending 5,000 a month today will need about 14,070 a month at 65 just to buy the same things, if inflation averages 3%. That single step, turning today's spending into future spending, is where most back-of-envelope retirement numbers go wrong. People picture their current budget and forget that 35 years of 3% inflation nearly triples it.
This guide builds a retirement target the same way the Retirement Calculator does, one assumption at a time, so you can see which ones matter. All figures use the calculator's default inputs and are shown in US dollars, but the method works for any currency. It explains a planning method; it is not personal financial advice, and the assumptions below deserve a second opinion against your own accounts.
Step 1: Inflate today's spending
Start with what you spend now and inflate it to your retirement date:
future monthly spending = today's spending × (1 + inflation)^years
5,000 × 1.03^35 = 5,000 × 2.8139 = 14,069 a month at 65.
Inflation is the quiet driver of the whole calculation. At 2% the same spending becomes 10,000 a month; at 4% it becomes 19,730. If you are unsure, run the calculator at two or three rates.
Step 2: Adjust for how retirement spending differs
Retirement usually removes some costs: commuting, work clothes, payroll taxes and, importantly, saving for retirement itself. The Retirement Income Ratio captures this. Many planners start at 70% to 85% of pre-retirement spending; the calculator defaults to 80%.
Health costs often move the other way. The calculator treats health insurance separately: it is inflated with everything else but not reduced by the ratio, because there is no reason to expect it to fall.
With the defaults:
- Living costs: 14,069 × 80% = 11,256
- Health insurance: 800 today, inflated to 2,251
- Total monthly spending at 65: about 13,507
Step 3: Subtract guaranteed income
Not all of that has to come from savings. Social Security, a defined-benefit pension and a spouse's benefits pay part of it. The calculator subtracts these from monthly spending to get the gap your savings must fill:
13,507 − 2,000 Social Security = 11,507 a month.
The calculator uses benefit amounts exactly as you enter them. Social Security statements in the US quote estimates at current dollar values, and benefits are adjusted for inflation each year, so entering today's estimate understates the benefit against inflated spending. That errs on the safe side. If you want a closer number, inflate the estimate to your retirement year before entering it.
Step 4: Multiply by the years in retirement and add one-off goals
The calculator multiplies the monthly gap by 12 and by the number of years from retirement to your life expectancy:
11,507 × 12 × 20 = 2,761,570
This assumes that, once you are retired, your investments earn roughly what inflation takes away, so a dollar of real spending costs a dollar of savings in every year. It is a simple, conservative assumption. A real portfolio that keeps growing faster than inflation would need less; one that lags would need more.
Then it adds one-off goals funded from the same pot: a long-term care fund (150,000 by default), a health emergency fund (50,000), and children's education and marriage funds if you switch them on. With the defaults the target is:
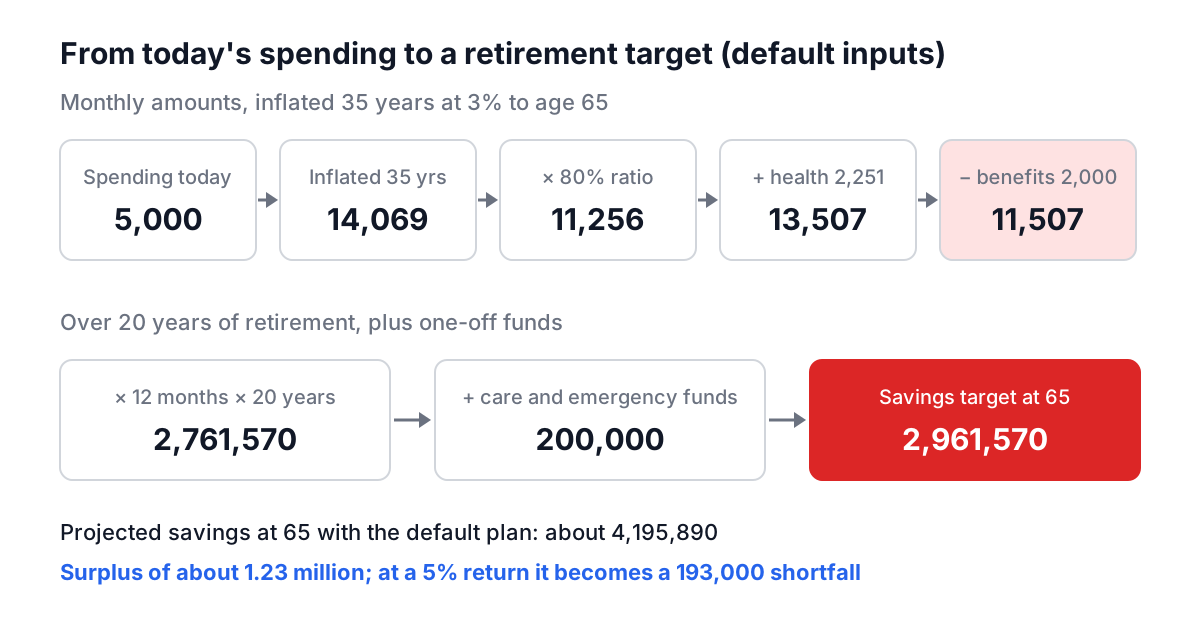
2,761,570 + 200,000 = about 2.96 million.
Step 5: Project your savings
Now the other side. The calculator projects your savings year by year:
balance(next year) = balance × (1 + return) + contributions × (1 + return / 2)
Contributions are assumed to arrive evenly through the year, so on average they earn half a year of return. Each year, contributions rise by your Annual Increase, a stand-in for pay rises.
Starting from 50,000 saved, with 1,000 a month plus a 500 employer match rising 3% a year at a 7% return, the balance reaches about 697,000 by age 45 and about 4.20 million by 65. At today's prices that is about 1.49 million, which the Projections tab shows as the real value line. Against a 2.96 million target, the default plan shows a surplus.
Which assumptions move the answer most
Change one input at a time and the sensitivity becomes obvious:
| Change | Savings at retirement | Target | Result |
|---|---|---|---|
| Default (7% return, retire at 65) | 4.20 million | 2.96 million | Surplus 1.23 million |
| Return 5% instead of 7% | 2.77 million | 2.96 million | Shortfall 0.19 million |
| Return 9% instead of 7% | 6.54 million | 2.96 million | Surplus 3.58 million |
| Retire at 62 | 3.30 million | 3.06 million | Surplus 0.24 million |
| Retire at 68 | 5.31 million | 2.80 million | Surplus 2.51 million |
| No annual contribution increase | 3.11 million | 2.96 million | Surplus 0.15 million |
Two points of return swing the outcome from a 190,000 shortfall to a 3.6 million surplus. That is the honest message of any retirement projection: it is far more sensitive to the return and the retirement date than to the fine detail of your budget. Retiring three years earlier both shrinks the pot and stretches the years it must cover.
When the plan shows a shortfall, the Strategy tab suggests an extra monthly contribution. It accounts for growth: at a 5% return, the 193,000 gap above closes with about 174 a month more over 35 years, far less than the 460 you would get by dividing the shortfall by the number of months.
How this compares with the 4% rule
The 4% rule comes from William Bengen's 1994 study of US market history. He found that withdrawing 4% of the starting portfolio, then raising the amount with inflation each year, lasted at least 30 years in every historical period he tested with a balanced stock and bond mix. The 1998 Trinity study reached broadly similar conclusions. Turned around, it says you need 25 times your annual spending gap.
For the default numbers, 25 × 11,507 × 12 = 3.45 million, somewhat more than the calculator's 2.76 million for 20 years. The difference is the time horizon: the 4% rule is built for 30 years and for bad market sequences, while the calculator divides evenly over your stated life expectancy. Neither is a guarantee. If your plan only works under one of them, treat it as tight.
Mistakes worth avoiding
- Using today's spending as the target. Always inflate it.
- Planning to life expectancy exactly. Roughly half of people outlive the average. Add five years to be cautious.
- Using a nominal return with a real target, or the reverse. The calculator keeps both nominal; do the same with your own numbers.
- Ignoring sequence risk. The projection has no volatility. A large fall in the first years of retirement does more damage than the same fall later.
- Forgetting taxes on withdrawals. Money in tax-deferred accounts is taxed when you take it out, so the spendable amount is lower than the balance.
A practical routine
Run the Retirement Calculator once with your honest numbers, then once each with a return two points lower, inflation one point higher and retirement three years earlier. If the plan holds in all three, you have room. If it fails in one, that tells you which lever to work on: saving more, working longer, or spending less in retirement. For the growth maths underneath, see the compound interest guide; for aggressive early-retirement targets, the FIRE Planner works through the same questions with a savings-rate lens.