
Solar Panel Payback Period: How to Work It Out Honestly
Payback, ROI, NPV and cost per kWh for rooftop solar, with export rates, degradation, inverter replacement and the end of the US 25D credit in the numbers.
· 11 min read
Solar quotes usually lead with a payback period: "your system pays for itself in 7 years". That number is only as good as the assumptions behind it, and the ones that matter most are often buried or missing: how exported power is credited, how fast panels lose output, whether the inverter needs replacing, and what electricity prices do next. This guide shows how to work out solar payback yourself, which assumptions move the answer most, and how to read ROI, NPV, IRR and cost per kWh. The Solar Panel Payback Calculator does every step with your own figures and shows the year-by-year table.
The simple version, and why it is not enough
The simplest payback calculation is net cost divided by first-year savings.
A 7 kW system at $3.00 per watt costs 7,000 x $3.00 = $21,000. If each kW of panels produces 1,400 kWh a year, the system makes 9,800 kWh. At 18 cents per kWh, close to the US Energy Information Administration's 2026 forecast for the average residential price, that electricity is worth $1,764. $21,000 / $1,764 = 11.9 years.
That figure assumes every kWh is worth the full retail price, panels never lose output, prices never change and nothing ever breaks. Each of those assumptions pushes the answer in a different direction, so the calculator models them year by year instead.
Step 1: production
Production is system size x specific yield, where specific yield is the kWh one kW of panels produces in a year at your site. It depends on latitude, roof direction and tilt, shading and local weather, so it varies a lot across the country. Get it from NREL's free PVWatts calculator: enter your address, roof tilt and azimuth, and divide its annual AC output by the system size in kW. If you already have a quote, the installer's production estimate does the same job; ask whether it includes shading and system losses.
Panels then lose a little output each year. NREL's review of field measurements (Jordan and Kurtz, 2013) found a median degradation rate of about 0.5% a year for crystalline silicon modules. At that rate the 25th year produces 0.995^24 = 88.7% of the first year's output, so a 9,800 kWh system makes about 8,690 kWh by then. Over 25 years it produces about 230,850 kWh in total.
Step 2: what each kWh is worth
This is where most payback estimates go wrong. A kWh of solar is worth different amounts depending on where it goes.
- Used in your home, it avoids buying a kWh from the grid, so it is worth your full retail price, including delivery charges that scale with kWh.
- Exported to the grid, it earns whatever your utility credits. Under classic net metering, exports offset imports one for one, so they are also worth retail. Under net billing, now common in many states including California, exports are credited at a lower avoided-cost or export rate, often a fraction of retail.
The calculator splits production by your expected self-use percentage. With 70% used at home and 30% exported at 8 cents:
- 6,860 kWh used at home x $0.18 = $1,235
- 2,940 kWh exported x $0.08 = $235
- First-year saving: $1,470, not $1,764.
Self-use depends on when you use power. Homes that are empty during the day export more; households with daytime occupants, an EV that charges at home in daylight, a heat pump or a battery use more of their own solar.
Step 3: prices over time
Both the retail price and the export credit tend to change. The calculator grows both by a yearly escalation rate, 2.5% by default. That is an assumption, not a forecast, so it is worth running a 0% case as well. Over 25 years, 2.5% a year raises the value of a kWh by 81%.
Step 4: costs along the way
Solar has few running costs, but not none. String inverters typically carry 10 to 12 year warranties and may need replacing once during the panels' life; microinverters and optimisers often carry 25-year warranties. The default model includes a $2,000 inverter replacement in year 12. Add any monitoring subscription, insurance increase or cleaning to the yearly upkeep field.
Putting it together
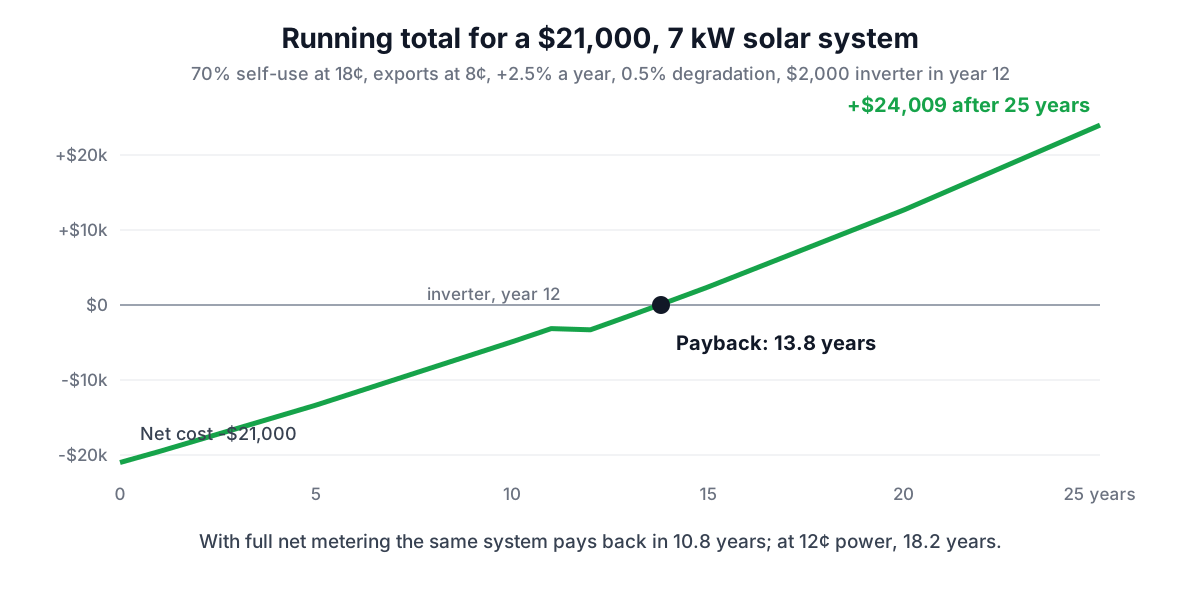
With all the defaults (7 kW at $3.00 per watt, 1,400 kWh per kW, 18-cent power with 70% self-use and an 8-cent export credit, prices rising 2.5% a year, 0.5% degradation and a $2,000 inverter in year 12), the running total looks like this:
| Year | Production | Net saving that year | Running total |
|---|---|---|---|
| 0 | -$21,000 | -$21,000 | |
| 1 | 9,800 kWh | $1,470 | -$19,530 |
| 5 | 9,605 kWh | $1,590 | -$13,352 |
| 10 | 9,368 kWh | $1,755 | -$4,913 |
| 12 | 9,274 kWh | -$175 (inverter) | -$3,298 |
| 13 | 9,228 kWh | $1,862 | -$1,437 |
| 14 | 9,182 kWh | $1,899 | +$462 |
| 20 | 8,910 kWh | $2,137 | +$12,673 |
| 25 | 8,689 kWh | $2,357 | +$24,009 |
The running total turns positive during year 14, so the payback period is 13.8 years, and the system is $24,009 ahead after 25 years.
ROI, NPV, IRR and cost per kWh
Payback tells you when you get your money back, not how good an investment it is. Four other figures help.
- ROI is the net gain divided by the net cost: $24,009 / $21,000 = 114% over 25 years.
- NPV (net present value) discounts each future year's saving to today's money. At a 4% discount rate the default system's NPV is $5,979: positive, so it beats an investment earning 4%.
- IRR (internal rate of return) is the discount rate at which NPV is zero, here 6.3% a year. Compare it with what the money would earn elsewhere, or with the interest rate on a loan used to pay for the system.
- Cost per kWh is the net cost plus upkeep and inverter divided by lifetime production: ($21,000 + $2,000) / 230,850 kWh = 10.0 cents. If your grid power costs more than that over the period, solar is the cheaper source.
The NPV and IRR Calculator and Payback Period Calculator explain these measures in general.
Which assumptions matter most
Each row below changes one input from the default:
| Change | Payback | 25-year gain | IRR |
|---|---|---|---|
| Default | 13.8 years | $24,009 | 6.3% |
| Full net metering (100% at retail) | 10.8 years | $33,411 | 8.3% |
| Only 40% used at home | 16.7 years | $14,608 | 4.1% |
| Electricity at 12 cents | 18.2 years | $10,847 | 3.2% |
| Electricity at 25 cents | 9.9 years | $39,366 | 9.4% |
| Sunny site, 1,700 kWh per kW | 10.7 years | $34,083 | 8.4% |
| Cloudy site, 1,100 kWh per kW | 16.9 years | $13,936 | 4.0% |
| Installed at $2.50 per watt | 10.8 years | $27,509 | 8.2% |
| No price rises (0% a year) | 16.3 years | $11,627 | 3.8% |
| No inverter replacement | 12.7 years | $26,009 | 6.8% |
| 30% tax credit | 9.2 years | $30,309 | 10.2% |
Your electricity price, the export rules and your site's sunshine dominate. Equipment choices matter less than the tariff you are on.
The end of the federal 25D credit
For years the US residential clean energy credit (section 25D) cut the cost of a home solar system by 30%, which shortened payback by roughly a third: the default system drops from 13.8 to 9.2 years with it. The One Big Beautiful Bill Act, signed in July 2025, ended the 25D credit for expenditures made after 31 December 2025. For systems installed in 2026 the federal credit therefore no longer applies, which is why the calculator defaults it to 0%. Check IRS guidance if your installation straddled the deadline, and look for state, utility and local rebates; enter fixed rebates in their own field.
Third-party-owned systems (leases and power purchase agreements) are treated differently, so a lease quote is not comparable with this calculation. Compare it by the price per kWh you would pay.
How to check a quote
- Confirm the system size in kW DC and the total installed price after any discounts.
- Check the production estimate against PVWatts for your address and roof.
- Find out how your utility credits exports, and estimate honestly how much you will use during daylight.
- Ask about the inverter warranty and include a replacement if it is shorter than your analysis period.
- Run the Solar Panel Payback Calculator with 0% and 2.5% price escalation to see the range.
To size a system in the first place, the Solar Panel Calculator and our guide on how many solar panels you need start from your yearly usage. If you are adding a heat pump or an EV, your daytime use rises, which usually improves self-use; see heat pump running costs.
Sources
- National Renewable Energy Laboratory, PVWatts Calculator (pvwatts.nrel.gov): site-specific production estimates.
- Jordan D. C. and Kurtz S. R. (2013), "Photovoltaic Degradation Rates: An Analytical Review", Progress in Photovoltaics 21(1), 12-29, NREL.
- US Energy Information Administration, Short-Term Energy Outlook, October 2026: 2026 forecast average residential electricity price.
- One Big Beautiful Bill Act (Public Law 119-21, 2025): termination of the section 25D residential clean energy credit for expenditures after 31 December 2025; IRS Fact Sheet 2025-05.
- Worked examples computed with the RedBison Solar Panel Payback Calculator.
Related searches
- solar panel payback period
- how long for solar panels to pay for themselves
- solar roi calculation
- net metering vs net billing savings
- solar panel degradation per year
- solar levelized cost per kwh
- is solar worth it without tax credit
- solar npv and irr