
ETF Fees, Dividends and Monthly Investing Over 30 Years
How an expense ratio compounds against you, what reinvesting dividends is worth, why contribution timing matters less than you think, and how inflation shrinks the final number.
· 6 min read
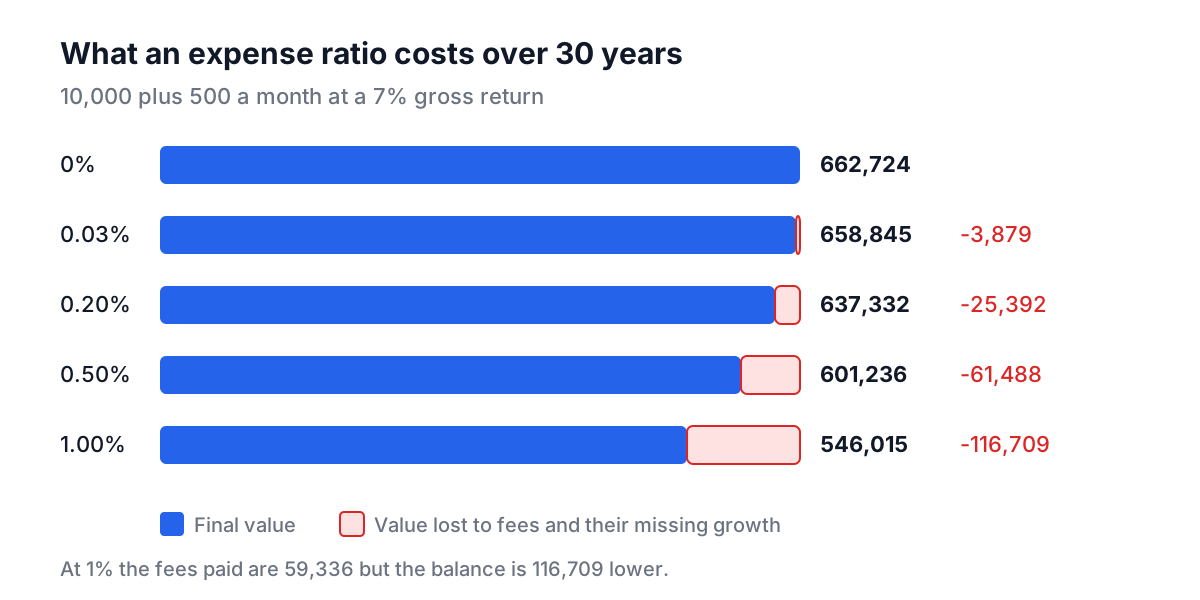
Invest 10,000 today and 500 every month for 30 years. At a steady 7% a year it grows to about 662,700. Pay a 1% annual fee on the same plan and it ends at about 546,000. The fees you actually paid add up to roughly 59,000, yet the final balance is about 117,000 lower. The other 58,000 is growth the fee money would have earned if it had stayed invested.
That gap is why the expense ratio is the first number index investors check. This guide uses the ETF Investment Simulator to show how fees, dividends, contribution timing and inflation each shape a long-term ETF plan. The examples use constant returns to make the mechanics visible; real markets are lumpier, and none of this is financial advice.
How an expense ratio compounds
An ETF's expense ratio is an annual fee expressed as a percentage of your holding. The fund does not send you a bill. It deducts the fee from fund assets a little at a time, so the fund's price and reported returns are already net of it. If the index returns 7% and the fund charges 0.5%, you get roughly 6.5%.
Half a percent sounds trivial. The damage comes from compounding: the fee is charged on a balance that keeps growing, and each fee payment also stops earning. Running 10,000 plus 500 a month for 30 years at a 7% gross return:
| Expense ratio | Final value | Fees paid | Lost vs no fee |
|---|---|---|---|
| 0% | 662,724 | 0 | 0 |
| 0.03% | 658,845 | 2,018 | 3,879 |
| 0.20% | 637,332 | 13,157 | 25,392 |
| 0.50% | 601,236 | 31,634 | 61,488 |
| 1.00% | 546,015 | 59,336 | 116,709 |
Two practical points follow. First, the difference between a 0.03% and a 0.20% fund is small next to the difference between 0.20% and 1%; broad index ETFs are cheap enough that fees stop being the deciding factor. Second, do not double count. Historical fund returns are already after fees, so if you use a fund's published 10-year return as your assumption, leave the simulator's Expense Ratio at 0. Only enter a fee when your return is a gross market figure.
Dividends: reinvest or take the cash
An ETF's total return has two parts: price growth and dividends. The simulator splits them using the dividend yield. With the SPY preset (10.2% total return, 1.3% yield), price growth is 8.9% a year and dividends are 1.3% of the average balance.
When dividends are reinvested, they buy more shares, which then grow and pay their own dividends. When they are taken as cash, the balance only gets price growth. For 10,000 to start, 500 a month and 50 more each year, over 30 years:
- Reinvested: about 2.13 million, with 214,300 of dividends along the way
- Paid out: about 1.70 million, plus 182,200 of dividends received as cash
The reinvested plan ends about 434,000 ahead, more than twice the cash dividends the other plan collected. That is compounding on the dividends themselves. Taking the cash only makes sense when you need the income.
Taxes are the catch. In a taxable account, most dividends are taxed in the year they are paid even when they are reinvested. The simulator does not model tax, so treat its reinvested figures as a tax-advantaged account, such as a 401(k) or IRA in the US, or an ISA in the UK.
Contribution timing and dollar-cost averaging
Investing a fixed amount on a schedule is called dollar-cost averaging. It buys more shares when prices are low and fewer when they are high, and it fits the way most people are paid.
The simulator spreads each year's contributions evenly through the year, the mid-year convention: on average, half of a year's money earns that year's return. Choosing weekly, bi-weekly, semi-monthly or monthly changes how the monthly amount is split (500 a month becomes 115.38 a week), not the yearly total, so the projection does not change. In real markets the frequency matters very little too. What matters is starting, and raising the amount over time.
The Contribution Increase field models that. Adding 50 a month every year turns a flat 500-a-month plan into one contributing 1,950 a month by year 30, and it takes the 30-year total contributed from 190,000 to 451,000. The first increase applies after the first full year, so year one is always at your starting amount.
If you have a lump sum available, investing it immediately has historically beaten spreading it out more often than not, simply because markets rise more years than they fall. The guide to SIP vs lump sum investing covers that comparison in detail.
Inflation: the number that shrinks the result
Thirty-year projections produce large numbers, and large numbers flatter. At 2.5% inflation, money loses about 52% of its purchasing power in 30 years: divide by 1.025^30, or 2.098.
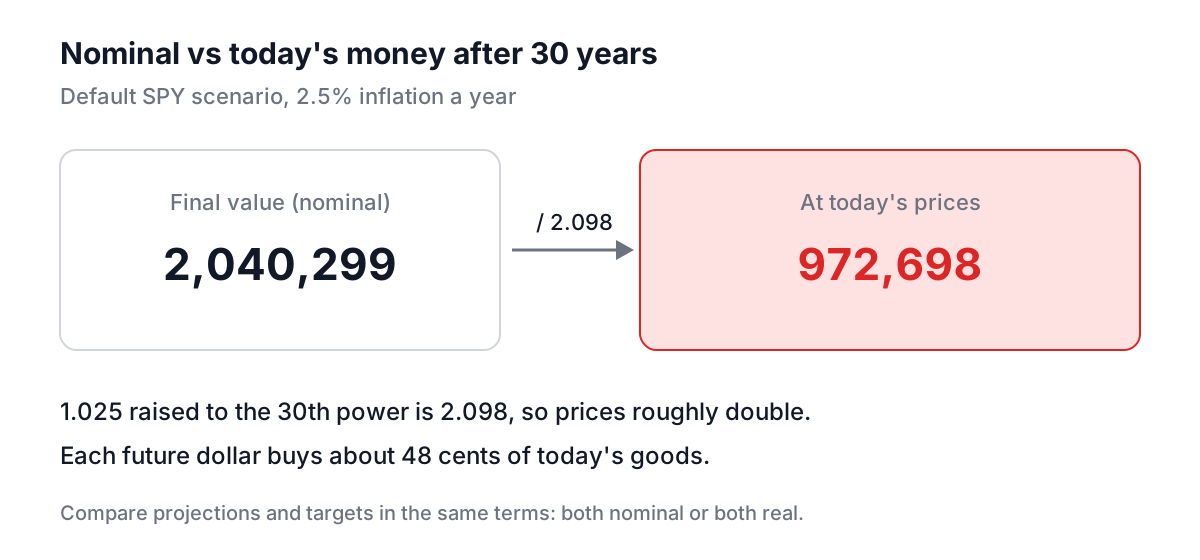
The simulator's default SPY scenario (5,000 to start, 500 a month rising 50 a year, dividends reinvested) reaches 2,040,299. At today's prices that is about 972,698. Both numbers are correct; only the second tells you what lifestyle the money buys. When you compare a projection with a retirement target, make sure both are in the same terms. The Retirement Calculator and the FIRE Planner both inflate spending to the future for that reason.
Common mistakes
- Using a best-decade return. The preset returns are rounded long-run illustrations. QQQ's 13.8% reflects an exceptional period for large tech stocks; plan with a lower figure.
- Ignoring the path. A constant 10% hides years of -30%. The final number is plausible; the ride to get there is not smooth, and selling in a crash breaks the projection.
- Double counting fees. Adding an expense ratio to an already-net historical return understates the outcome.
- Forgetting tax drag. Dividends and fund distributions in taxable accounts are taxed along the way.
- Reading nominal numbers as real. Always check the "at today's prices" line before deciding a plan is enough.
Running your own plan
Open the ETF Investment Simulator, pick a fund or switch on Use Custom Returns, and enter what you can actually invest each month. Run it twice: once at your expected return, and once 2 to 3 points lower. Set the expense ratio to the fund's real figure only if you entered a gross return, and set inflation so you can read the result at today's prices. Then use the Contribution Increase field to see what raising your monthly amount by a small step each year does. For the arithmetic of growth itself, the Compound Interest Calculator and the compound interest guide show the formula step by step.