
SIP vs Lump Sum: What the Maths Says About Investing Gradually
How SIP maturity is calculated, why a lump sum usually ends higher at the same return, and what that comparison leaves out about real markets.
· Updated · 6 min read
Invest 5,000 a month for five years at a steady 12% and you end with about 412,400. Invest the same 300,000 in one go on day one and you end with about 528,700. On paper the lump sum wins by more than 116,000, and that comparison gets quoted a lot as if it settles the SIP versus lump sum question.
It does not, because it compares two different situations. This guide shows how both numbers are calculated, why the gap exists, what the calculation quietly assumes, and how to use the Investment Calculator to make a comparison that means something. It is about the arithmetic of investing, not a recommendation for any fund or product.
How a SIP maturity value is calculated
A systematic investment plan (SIP) invests a fixed amount every month. Each instalment then compounds for however many months remain. The first of 60 instalments compounds for 60 months; the last compounds for one.
Summing all those pieces gives the future value of an annuity. Most SIP calculators, including this one, assume each instalment is invested at the start of its month, which makes it an annuity due:
FV = P × [((1 + i)^n − 1) / i] × (1 + i)

P = monthly instalment
i = monthly rate = annual rate / 12 / 100
n = number of months
For 5,000 a month at 12% for 60 months, i = 0.01:
- (1.01)^60 = 1.816697
- (1.816697 − 1) / 0.01 = 81.6697
- × 1.01 = 82.4864
- × 5,000 = 412,431.83
The final (1 + i) factor is the "start of month" assumption. Without it you get the ordinary annuity value of 408,348.35. That 4,083 difference is why two SIP calculators can disagree slightly on the same inputs. Check which convention a calculator uses before comparing its output with a fund house illustration.
At a 0% return the formula divides zero by zero, so the calculator handles it directly: the maturity value is just P × n.
How a lump sum is calculated
A lump sum is a single deposit compounding for the whole term. The Investment Calculator compounds it once a year:
A = P × (1 + r)^(months / 12)
For 300,000 at 12% for 60 months, A = 300,000 × 1.12^5 = 528,702.50. A term that is not whole years, such as 18 months, uses a fractional exponent: 10,000 × 1.12^1.5 = 11,852.97.
Note that SIP mode compounds monthly (12% nominal, about 12.68% effective) while lump sum mode compounds annually (exactly 12%). That slightly favours the SIP, and it is small next to the timing effect below.
Why the lump sum ends higher
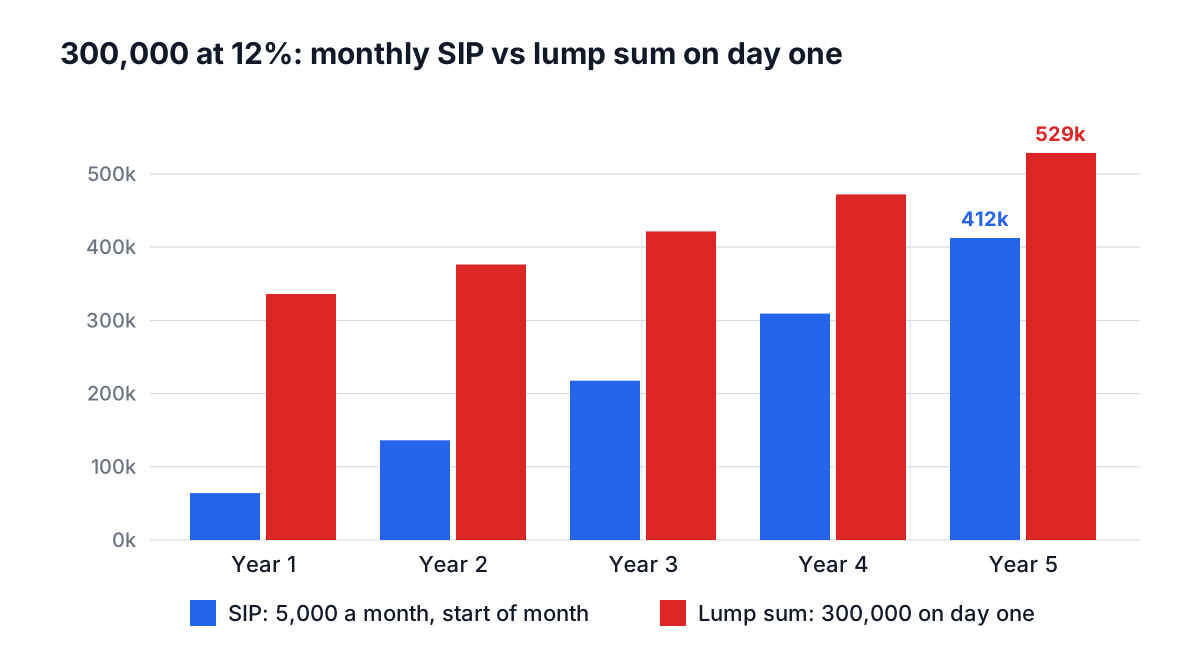
The answer is exposure. In the lump sum case, all 300,000 is invested for all 60 months. In the SIP, the average instalment is invested for about 30.5 months, roughly half the term. Half the time in the market at the same return will always produce less growth.
| Year | SIP invested | SIP value | Lump sum value |
|---|---|---|---|
| 1 | 60,000 | 64,046.64 | 336,000.00 |
| 2 | 120,000 | 136,216.00 | 376,320.00 |
| 3 | 180,000 | 217,538.24 | 421,478.40 |
| 4 | 240,000 | 309,174.17 | 472,055.81 |
| 5 | 300,000 | 412,431.83 | 528,702.50 |
So the honest reading is: if you already have the money and returns are positive and steady, investing it all now produces more than drip-feeding it. That is just compound interest. It does not mean a SIP is a worse product.
What the comparison leaves out
Most people do not have the lump sum. A SIP is usually funded from monthly salary. The real alternative to a 5,000 SIP is not a 300,000 lump sum; it is not investing that 5,000 at all, or investing it later.
Returns are not steady. The calculator applies the same return every year. Real markets move around, and the order of returns matters for a lump sum: a fall in the first year hits all of your money, while a SIP buys more units at the lower price.
The waiting money is not idle. If you do hold 300,000 and choose to invest it gradually, the uninvested part sits in a savings account or liquid fund earning something. A fair comparison credits that interest.
The effect of buying at different prices is called rupee-cost (or dollar-cost) averaging. A fixed amount buys more units when prices are low and fewer when high, so your average cost per unit ends up below the average price:
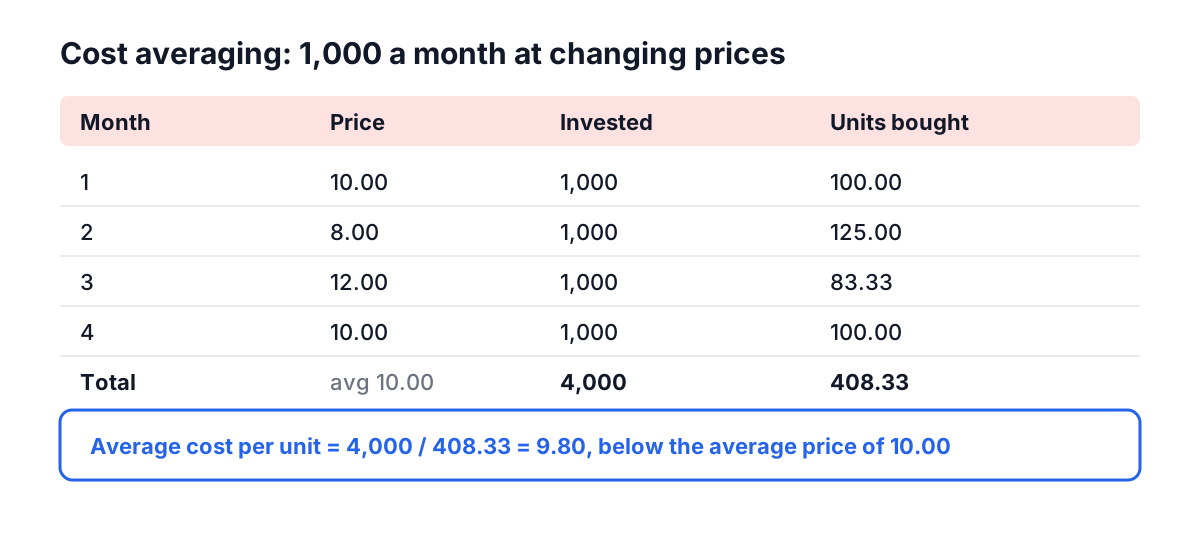
Four purchases of 1,000 at prices 10, 8, 12 and 10 buy 408.33 units, an average cost of 9.80, while the average price was 10.00. The gap is mathematical: the average cost is the harmonic mean of the prices, which is never higher than the ordinary mean. It is a modest benefit, not a guarantee of profit, and it does nothing if prices only go up.
Running a useful comparison
The Investment Calculator is most useful for questions it can answer cleanly:
- How much does a monthly habit become? 5,000 a month at 12% for 120 months reaches about 1,161,695 on 600,000 invested. Doubling the term more than doubles the growth.
- How sensitive is the plan to the return? Run 8%, 10% and 12%. Plan around the lower results.
- What does a windfall add? Run the lump sum separately and add it to the SIP result.
- What does inflation do? Enter a real return, for example 12% minus 5% inflation is about 7%, to see the result as purchasing power at current prices.
To see the actual performance of a SIP you already run, with real prices and dates, log the instalments in the Time-Weighted Return Calculator, which reports the money-weighted return (XIRR) on your actual cash flows.
Common mistakes
- Entering years in the duration field. Duration is in months; ten years is 120.
- Comparing SIP and lump sum results with different totals. Keep total money equal, or the comparison measures the amount, not the method.
- Using the best historical return. A 15% assumption over 20 years produces numbers that make any plan look easy.
- Ignoring costs. Expense ratios, taxes and exit loads reduce the rate. A 1% annual fee takes about a sixth of the final value over 20 years at 10%.
- Treating the result as a promise. The projection is a constant-return model. Real outcomes vary around it, sometimes a lot.
Where to go from here
Decide which question you are asking first. If it is "what will my monthly saving become?", use SIP mode with a conservative return and a realistic term. If it is "should I invest this windfall now or spread it out?", the maths favours investing now when returns are positive, and spreading it out mainly buys peace of mind against a bad first year. For longer horizons, the retirement savings guide shows how monthly investing fits into a full plan, and the compound interest guide covers the formula underneath both modes.
Frequently asked questions
What is the difference between annuity due and ordinary annuity in a SIP calculation?
An annuity due assumes each SIP instalment is invested at the start of its month, so the formula has a final (1 + i) factor; an ordinary annuity assumes the end of the month. For 5,000 a month at 12% for 60 months, the annuity due gives 412,431.83 and the ordinary annuity 408,348.35, which is why two SIP calculators can disagree slightly.
What is rupee cost averaging?
Rupee cost averaging, also called dollar-cost averaging, means investing a fixed amount regularly, so it buys more units when prices are low and fewer when they are high. Four purchases of 1,000 at prices 10, 8, 12 and 10 buy 408.33 units, an average cost of 9.80 against an average price of 10.00. It is a modest benefit, not a guarantee of profit.
Should I invest a windfall as a lump sum or spread it out through a SIP?
With positive, steady returns, the maths favours investing a windfall now, because the whole amount compounds for the whole term. Spreading it out mainly buys peace of mind against a bad first year, since a fall then hits all of a lump sum. A fair comparison also credits the interest the uninvested money earns in a savings account or liquid fund while waiting.
How much does a 5,000 monthly SIP become in 10 years?
At a steady 12% annual return, investing 5,000 a month for 120 months reaches about 1,161,695 on 600,000 invested. Over five years the same SIP reaches about 412,432, so doubling the term more than doubles the growth. The projection is a constant-return model, so run lower rates such as 8% and 10% and plan around the lower results.
How much do fees reduce long-term investment returns?
Expense ratios, taxes and exit loads all reduce the effective rate of return. A 1% annual fee takes about a sixth of the final value over 20 years at a 10% return. Entering a rate that is already net of costs, and of inflation if you want purchasing power, gives a more realistic projection than using the gross or best historical return.
Sources and further reading
- 6.4 Compound Interest, OpenStax. Growth of a single lump sum.
- 6.6 Methods of Savings, OpenStax. Future value of regular deposits.
- Compound Interest Calculator, US Securities and Exchange Commission.
Open the Investment Calculator
More Calculators
Every tool in the Calculators section, free and in your browser.
- Investment Calculator
- Compound Interest Calculator
- Simple Interest Calculator
- Interest Calculator
- EMI Calculator
- Retirement Calculator
- Time-Weighted Return Calculator
- Savings Goal Calculator
- Inflation Calculator
- CAGR Calculator
- ROI Calculator
- Present and Future Value Calculator
- NPV and IRR Calculator
- 401(k) Calculator
- Roth IRA Calculator
- APY and CD Calculator
- SIP Calculator
- Annuity Calculator
- Bond Price and Yield Calculator
- Currency Converter
- Dividend Calculator
- Stock Average Calculator
- RMD Calculator