
Margin, Markup and Break-Even: The Arithmetic of Pricing
Why a 40% markup is not a 40% margin, how contribution margin sets your break-even volume, and how sales commission and discounts eat into both.
· 8 min read

A shop owner buys a lamp for 60 and wants a 40% margin. She adds 40% to the cost, puts 84 on the tag, and sells 500 lamps that season. Her accountant later reports a gross margin of 28.6%, and she has left 8,000 on the table without ever selling below cost. Nothing went wrong with the lamps. The mistake was in one word: she used markup maths to hit a margin target.
This guide covers the three pieces of arithmetic that sit under almost every pricing decision in a small business: margin and markup, contribution margin and break-even, and the way sales commission feeds into both. Every number here can be reproduced in the Margin and Markup Calculator, the Break-Even Calculator and the Commission Calculator. It explains the maths and the judgment calls; it is not tax or legal advice.
Margin and markup are the same profit divided by different numbers
Start with one sale: cost 60, price 100, profit 40.
- Gross margin divides profit by the selling price: 40 / 100 = 40%.
- Markup divides profit by the cost: 40 / 60 = 66.67%.
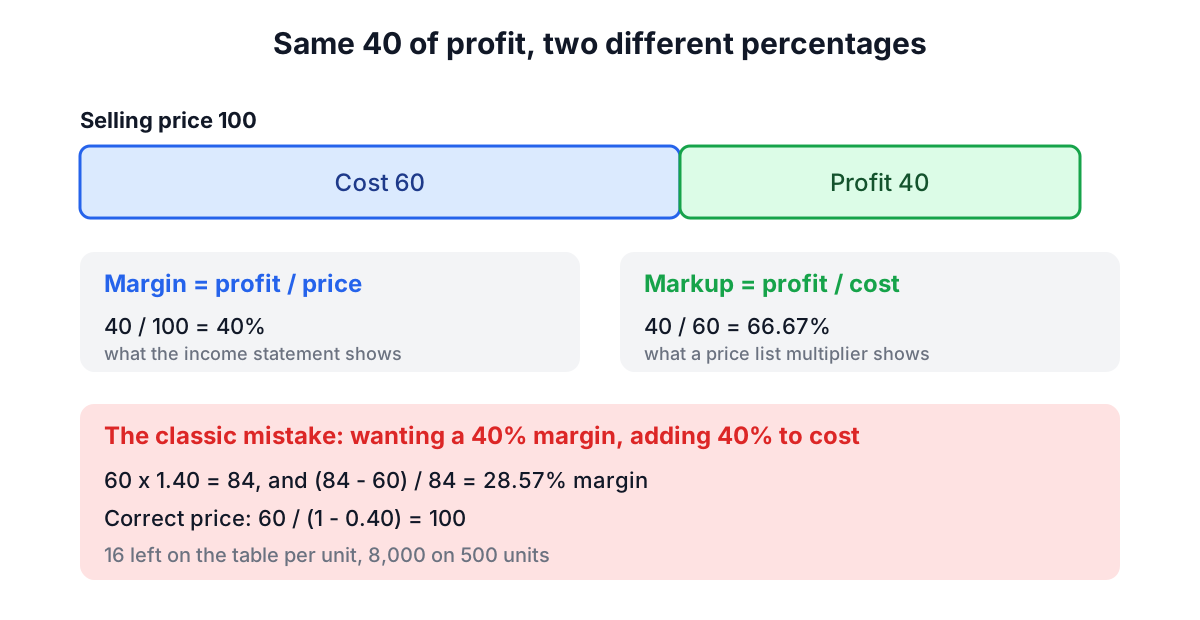
Both numbers are correct. They answer different questions. Margin tells you how much of each sale you keep, which is why it appears on income statements and in investor decks. Markup tells you what to multiply cost by, which is why buyers and shop floors use it. Because cost is smaller than price whenever you make money, markup is always the bigger number, and that gap is what catches people out.
The conversions are short:
markup = margin / (1 - margin)
margin = markup / (1 + markup)
price  = cost / (1 - margin)      (pricing from a margin target)
price  = cost x (1 + markup)      (pricing from a markup)
A few pairs are worth memorising: 20% margin is 25% markup, 25% margin is 33.3% markup, 50% margin is 100% markup (the retail "keystone" of doubling cost), and 75% margin is 300% markup. Margin can never reach 100% while the item costs anything. Markup has no ceiling.
Where the money leaks
The lamp example is the most common leak: a 40% margin target priced as a 40% markup. Cost 60 times 1.4 is 84, and 24 / 84 is 28.57%. The correct price is 60 / 0.6 = 100. The calculator puts this comparison under every result, with the shortfall per unit and across your volume, because it is the error people make while feeling confident.
Discounts leak the same way. Taking 20% off a 100 item with a 60 cost leaves 80 of revenue and 20 of profit, a 25% margin. Half the margin has gone, not a fifth of it. If promotions are routine, set list prices so the discounted price still meets your margin floor.
The other leak is an incomplete "cost". Freight in, duties, packaging, payment processing fees, returns and the commission paid on the sale all come out of each unit. Leave them out and the margin you calculate is a margin you never see.
Contribution margin: what each sale pays toward the rent
Gross margin looks at one product's price against its direct cost. Break-even analysis asks a broader question: how many sales does it take to pay for everything, including costs that do not move with volume?
Split costs into two kinds:
- Fixed costs stay the same within a normal range of activity: rent, salaries, insurance, software subscriptions, loan interest.
- Variable costs rise with each unit sold: materials, shipping, card fees, sales commission.
Contribution margin per unit is price minus variable cost. It is the slice of each sale that is free to pay fixed costs. As a ratio, contribution divided by price, it tells you what share of every sale does that work.
Take the classic management accounting example: fixed costs of 80,000 a period, a price of 250 and a variable cost of 150. Each unit contributes 100, a 40% contribution margin ratio.
break-even units   = fixed costs / contribution per unit = 80,000 / 100 = 800
break-even revenue = fixed costs / contribution ratio    = 80,000 / 0.40 = 200,000
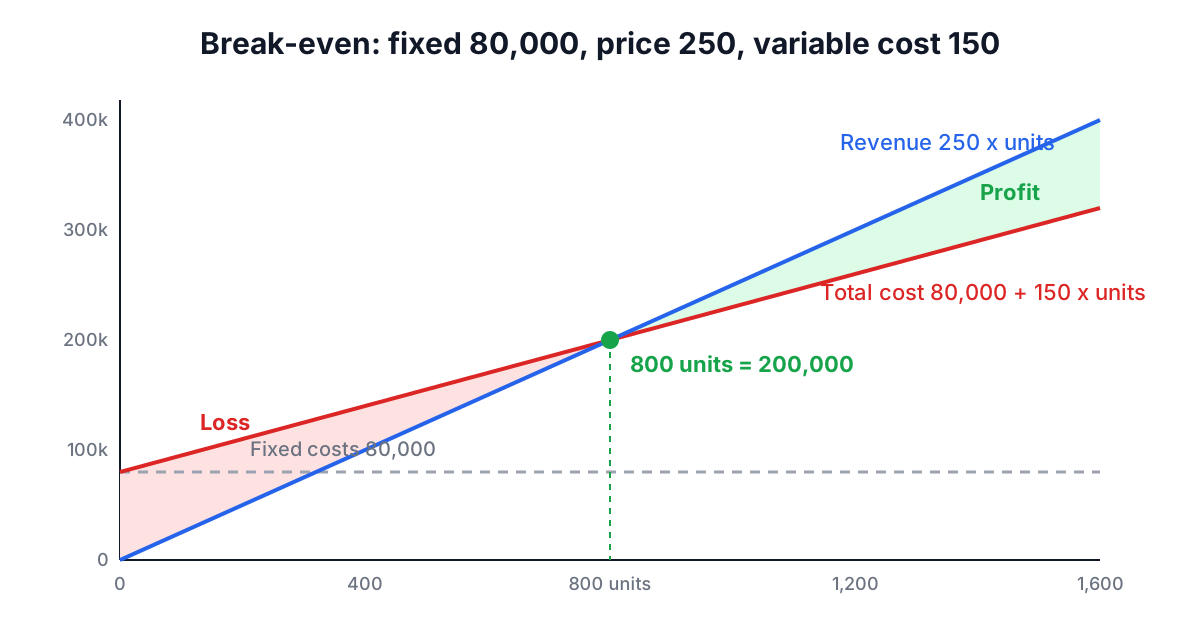
Below 800 units the business loses money each period; above it, every extra unit adds 100 of profit. When the answer is fractional, round up. Selling 333 units when break-even is 333.33 still leaves a small loss.
Targets, safety margins and leverage
Break-even is a floor, not a goal. Three extensions make it useful for planning.
Target profit. Add the profit you want to the fixed costs: (80,000 + 20,000) / 100 = 1,000 units. If the target is after tax, gross it up first. Keeping 15,000 at a 25% tax rate needs 15,000 / 0.75 = 20,000 of pre-tax profit, which is the same 1,000 units.
Margin of safety. If you expect to sell 1,000 units, the margin of safety is (1,000 - 800) / 1,000 = 20%. Sales can fall a fifth before you stop making money. It is a blunt but honest measure of how much bad luck a plan can absorb, and lenders read it that way.
Operating leverage. Divide total contribution by operating profit: 100,000 / 20,000 = 5. A 10% rise in sales lifts profit by about 50%, and a 10% fall cuts it by the same. Businesses with high fixed costs and high contribution margins, such as software companies, have high leverage. That is wonderful above break-even and painful below it.
Price changes hit contribution, not revenue
The most useful table in the Break-Even Calculator shows break-even volume at prices from 20% below to 20% above your own. A 10% discount on the 250 product takes 25 out of a 100 contribution. Break-even jumps from 800 to 1,067 units, a third more volume to earn nothing extra. A 10% price rise does the reverse and drops break-even to 640. Before running a promotion, ask whether it will really lift volume by more than the contribution it gives away.
Commission is a variable cost with a shape
For a business, commission is part of variable cost per unit, so it lowers contribution and raises break-even. For the person earning it, the plan's shape matters as much as the rate.
A flat plan is easy: 25,000 of sales at 6% pays 1,500. Tiered plans come in two readings, and disputes usually come from people assuming different ones. Take tiers of 5% up to 10,000, 7% from 10,000 to 20,000 and 10% above 20,000, and sales of 25,000.
- Marginal (graduated) tiers pay each slice at its own rate: 500 + 700 + 500 = 1,700, an effective 6.8%.
- Whole-amount (retroactive) tiers pay the highest rate reached on everything: 10% of 25,000 = 2,500.
Whole-amount plans create cliffs. At 10,000 of sales the rep earns 500; at 10,001, 700.07. Those cliffs push people to hold deals back or pull them forward to land just over a threshold, which distorts forecasts. Marginal tiers and accelerators that apply only above quota avoid the jump.
A draw against commission is an advance paid every period. Under a recoverable draw, a shortfall is carried forward and repaid from later commission. With a 2,000 monthly draw, a 6% rate and sales of 15,000, 40,000, 30,000 and 55,000, the rep is paid 2,000 for three months while a balance builds, then 2,400 in month four once the last 900 is recovered. Total pay equals total commission earned, 8,400. A non-recoverable draw forgives each shortfall and works as a guaranteed minimum. What happens to a balance when someone leaves is set by the plan document and local wage law, not by arithmetic.
The commission calculator also runs the question backwards. On the marginal plan above, earning 3,000 needs 38,000 of sales: the first two tiers give 1,200, and the remaining 1,800 at 10% needs another 18,000.
Putting it together
A sensible order of work for a new product or a price review:
- List every variable cost per unit, including payment fees and commission. Use the Margin and Markup Calculator with "cost and target margin" to get a price that meets your margin floor, and check the discount you plan to offer still clears it.
- Put that price, the variable cost and your fixed costs into the Break-Even Calculator. Compare break-even units with the volume you can honestly expect, and look at the margin of safety.
- If you pay a sales team, model the plan in the Commission Calculator at realistic volumes, not just at quota, and feed the effective rate back into variable cost.
The assumptions behind all of this are simple: constant prices and unit costs, fixed costs that stay fixed, and everything you make gets sold. Real businesses bend each one, so revisit the numbers when volume moves into a new range. For the customer side of unit economics, the LTV and CAC guide covers how much you can spend to win each customer, and the market sizing guide helps you check whether the break-even volume is a realistic slice of the market at all.