
Rent vs Buy: Comparing Net Worth, Not Monthly Payments
Why comparing rent with a mortgage payment gives the wrong answer, how opportunity cost and selling costs change it, and how to find your break-even year.
· 6 min read
A 400,000 house with 20% down and a 6.5% mortgage costs 2,022.62 a month in principal and interest. The flat next door rents for 2,500. Put those two numbers side by side and buying looks cheaper by almost 500 a month. It is also the wrong comparison. It leaves out property tax, insurance and maintenance on one side, and on the other it ignores what the 88,000 of down payment and closing costs would have earned if the renter had invested it instead.
The question to ask is not "which monthly payment is lower" but "which household is richer after N years". This guide walks through that comparison with the Rent vs Buy Calculator and its default inputs. It explains a method; your own numbers and circumstances decide the answer, and none of this is financial advice.
Why monthly payments mislead
A mortgage payment and a rent cheque are not the same kind of money. Part of the mortgage payment is principal, which you get back as equity. The rest, interest, is a cost like rent. Owning also brings costs that renters never see:
- Property tax (6,000 a year in the default scenario)
- Home insurance (1,200)
- Maintenance and repairs (4,000, about 1% of the price)
- HOA or service charges where they apply
- Closing costs when you buy and selling costs when you leave
Renting has its own hidden benefit: the cash that a buyer locks into a house stays liquid and can be invested. That is the opportunity cost, and it is the line most homemade spreadsheets leave out.
The net worth method
The approach most careful calculators use, popularised by the New York Times rent-versus-buy calculator, compares two parallel households:
- Day one. The buyer pays the down payment and closing costs. The renter invests the same amount instead.
- Every year. Add up each household's housing costs. For the buyer that is mortgage payments, tax, insurance, maintenance and HOA, minus any tax saved by deducting interest and property tax. For the renter it is rent and renter's insurance. Whichever household spent less invests the difference.
- At the end. The buyer's net worth is the home's value after selling costs, minus the mortgage balance, plus anything they invested. The renter's net worth is their portfolio.
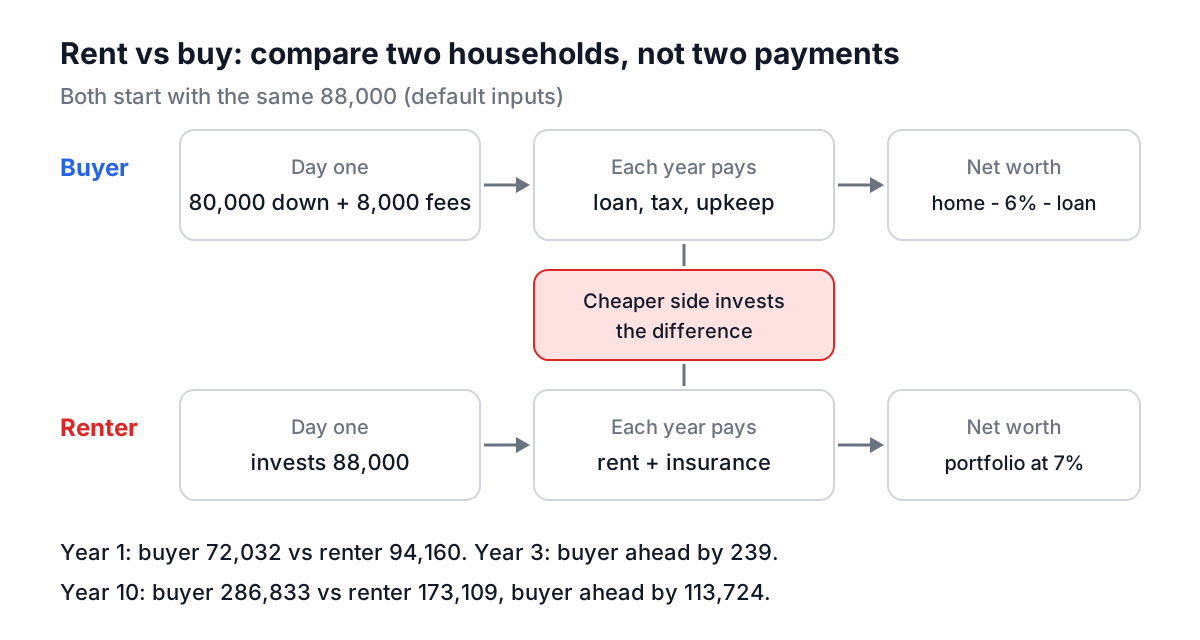
The difference between the two net worth figures is the answer. If it is positive, buying came out ahead; if negative, renting did.
A worked example
The calculator's defaults: a 400,000 home, 80,000 down, 8,000 closing costs, 6.5% for 30 years, 6% selling costs, 6,000 property tax, 1,200 insurance, 4,000 maintenance. Rent is 2,500 a month rising 3% a year. Home values grow 3% a year, investments return 7%, inflation is 2.5% and the marginal tax rate is 24%.
Year one costs. The buyer pays 24,271 in mortgage payments, 11,200 in tax, insurance and maintenance, and saves about 6,407 in tax by deducting interest and property tax. Net cost: 29,065. The renter pays 30,000 in rent and 200 in insurance: 30,200. The buyer is cheaper this year, so the buyer invests the 1,135 difference.
Year one net worth. The home is worth 412,000, or 387,280 after 6% selling costs. The loan balance is 316,423. With the small investment, the buyer's net worth is about 72,032. The renter's 88,000 grew 7% to 94,160. Renting is ahead by 22,128.
That gap is almost entirely transaction costs. 8,000 of closing costs and 24,720 of selling costs disappear the moment you own, and one year of 3% appreciation does not recover them.
| Year | Buy minus rent |
|---|---|
| 1 | -22,128 |
| 2 | -11,403 |
| 3 | +239 |
| 5 | +26,550 |
| 10 | +113,724 |
The buyer pulls ahead in year 3 and leads by about 113,700 after ten years.
Which assumptions move the answer
The break-even year is only as good as the rates behind it. Changing one input at a time from the defaults:
| Change | Break-even year | 10-year result |
|---|---|---|
| Defaults | 3 | buy ahead 113,724 |
| Appreciation 1% instead of 3% | 8 | buy ahead 23,749 |
| No tax deduction (tax rate 0) | 7 | buy ahead 23,796 |
| Rent 2,000 instead of 2,500 | 8 | buy ahead 16,967 |
| Rent never rises | 4 | buy ahead 58,938 |
| Appreciation 1% and no deduction | 11 | rent ahead 66,179 |
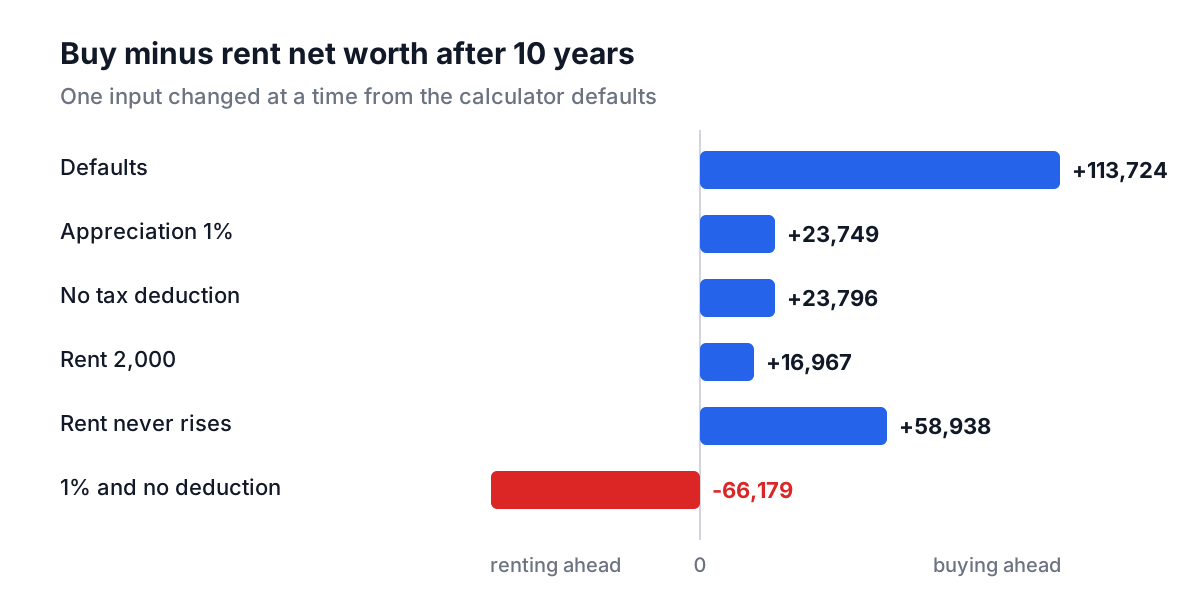
Three lessons stand out. Appreciation is the biggest lever, and nobody knows it in advance. The tax deduction matters a lot in this model, and in the US many households get little or none of it because they take the standard deduction or hit the cap on state and local tax deductions, so the conservative case is to set the tax rate to 0. And the ratio of price to rent matters: a house that would rent for 2,000 is a much weaker purchase at 400,000.
Common mistakes
- Forgetting the opportunity cost. Without it, modest appreciation can make buying look like a winner when it is not.
- Leaving out selling costs. Agent fees, transfer taxes and legal costs often add up to 5% to 10% of the price. If there is a real chance you move within three years, they usually decide the question.
- Assuming the renter will invest the difference. The method only works if the renter actually invests the down payment and any monthly savings. If that money would be spent, the comparison flatters renting.
- Ignoring maintenance. One percent of the home's value a year is a common rule of thumb, more for older houses. A new roof does not care about your spreadsheet.
- Treating rent as dead money. Interest, property tax and insurance are just as unrecoverable. Only principal and appreciation build the buyer's wealth.
Using the calculator
Enter your real numbers in the Rent vs Buy Calculator: the actual listing price, the property tax bill, HOA fees and the rent on a comparable home. Set Selling Costs to what agents in your area charge. Then run a pessimistic case next to the default, lower appreciation, no tax benefit and a 5% investment return, and compare the break-even year with how long you realistically expect to stay.
To see the payment schedule behind the mortgage, the EMI Calculator builds a month-by-month amortisation table, and the EMI and amortization guide explains why early payments are mostly interest. If you are thinking about buying a property to let rather than to live in, the Real Estate Investment Analyzer works out cap rate and cash flow instead.
If the break-even year is shorter than your expected stay in both the optimistic and pessimistic runs, buying is probably the better financial bet. If it only works under the rosy assumptions, renting and investing the difference is a perfectly sound choice.