
How to Draw Shear Force and Bending Moment Diagrams, Step by Step
Reactions from equilibrium, the cut-and-sum method, the dV/dx and dM/dx rules, sign conventions, overhangs and cantilevers, with fully worked numbers.
· 11 min read
Shear force and bending moment diagrams are the first drawings in almost every beam calculation. They turn a list of loads into two curves along the span, and those curves tell you everything the design checks need: the largest moment for bending, the largest shear for the web and connections, and the points where the beam changes from sagging to hogging. This guide works through the method from equilibrium to finished diagrams, with the rules that let you sketch them quickly and check a computer result at a glance. Every example can be reproduced in the Shear and Bending Moment Calculator.
Step one: reactions from equilibrium
A beam at rest obeys two equations in the vertical plane: the vertical forces add to zero, and the moments about any point add to zero. For a beam on a pin and a roller, those two equations are enough to find the two unknown reactions, which is what statically determinate means.
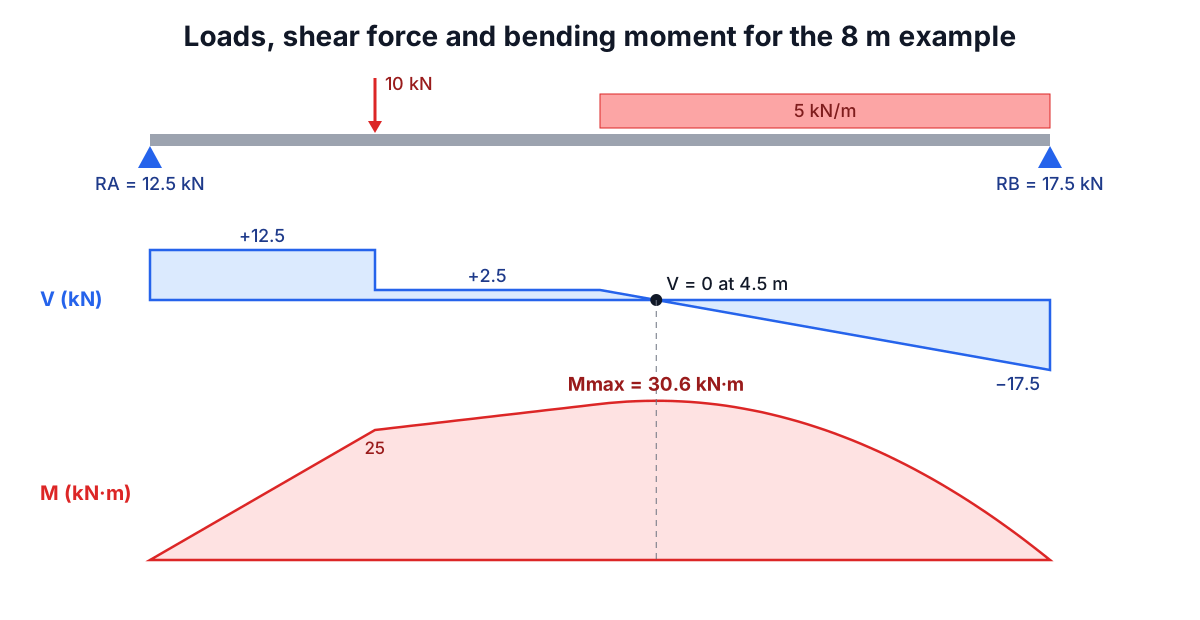
Take an 8 m beam supported at both ends with a 10 kN point load 2 m from the left and a uniform load of 5 kN/m over the right half, from 4 m to 8 m. Replace the distributed load by its resultant: 5 x 4 = 20 kN acting at the middle of its length, 6 m from the left. Then take moments about the left support A:
RB x 8 = 10 x 2 + 20 x 6 = 140    ->  RB = 17.5 kN
RA     = 10 + 20 - 17.5            ->  RA = 12.5 kN
The check is to take moments about B as well; if both give the same answers, the reactions are right. For a triangular load the resultant is half the base times the peak intensity, and it acts one third of the length from the heavy end.
Step two: cut the beam and sum the forces
Imagine cutting the beam at a distance x from the left end and looking only at the left-hand piece. For that piece to be in equilibrium, the cut face must carry an internal shear force V and an internal bending moment M:
V(x) = (upward forces left of x) - (downward loads left of x)
M(x) = sum of (each force left of x) x (its distance to x), plus any applied couples left of x
That is the whole method. Every textbook trick is a shortcut for evaluating these two sums.
For the example, between 0 and 2 m only RA is to the left, so V = 12.5 kN and M = 12.5x. Between 2 m and 4 m the point load is included, so V = 2.5 kN. Beyond 4 m the distributed load starts eating into the shear at 5 kN per metre:
V(x) = 2.5 - 5 (x - 4) for 4 <= x <= 8
V reaches zero at x = 4.5 m. The moment there is 12.5 x 4.5 − 10 x 2.5 − 5 x 0.5² / 2 = 30.625 kN·m, the largest anywhere on the beam.
The three rules that let you sketch diagrams quickly
Differentiate the sums above and you get two relationships that make hand-drawing fast:
dV/dx = -w(x)        the slope of the shear diagram is minus the load intensity
dM/dx =  V(x)        the slope of the moment diagram is the shear
From these follow the practical rules:
- Point loads make the shear diagram jump by the load, and put a kink in the moment diagram. Between point loads with no distributed load, V is constant and M is a straight line.
- A uniform load makes the shear diagram slope at a constant rate and the moment diagram a parabola. A triangular load makes V a parabola and M a cubic.
- The moment changes by the area under the shear diagram. From 0 to 2 m in the example the shear area is 12.5 x 2 = 25, so M(2) = 25 kN·m. From 2 to 4 m add 2.5 x 2 = 5, giving 30 kN·m at 4 m.
A corollary is the most useful fact in beam design: the moment is a maximum or minimum wherever the shear passes through zero. Under a distributed load that happens smoothly; at a point load or support the shear can jump straight across zero and the moment peaks right there. An applied couple is the exception to all of this: it does not change the shear but makes the moment diagram jump by its own value.
Sign conventions, and why they cause arguments
Books disagree on signs, so always state yours. The convention used in the calculator, and in Hibbeler, Gere and most design codes, is:
- downward loads are positive and upward reactions are positive;
- shear is positive when the left-hand piece is pushed up at the cut;
- sagging moment is positive, meaning the beam curves like a smile with tension on the bottom face;
- hogging moment is negative, with tension on the top face.
Structural engineers in some countries draw the moment diagram on the tension side of the beam, which puts positive moments below the axis. The numbers are the same; only the picture flips. What matters for design is which face is in tension, because that is where a concrete beam needs its reinforcement and where a steel compression flange may need bracing.
Overhangs and cantilevers
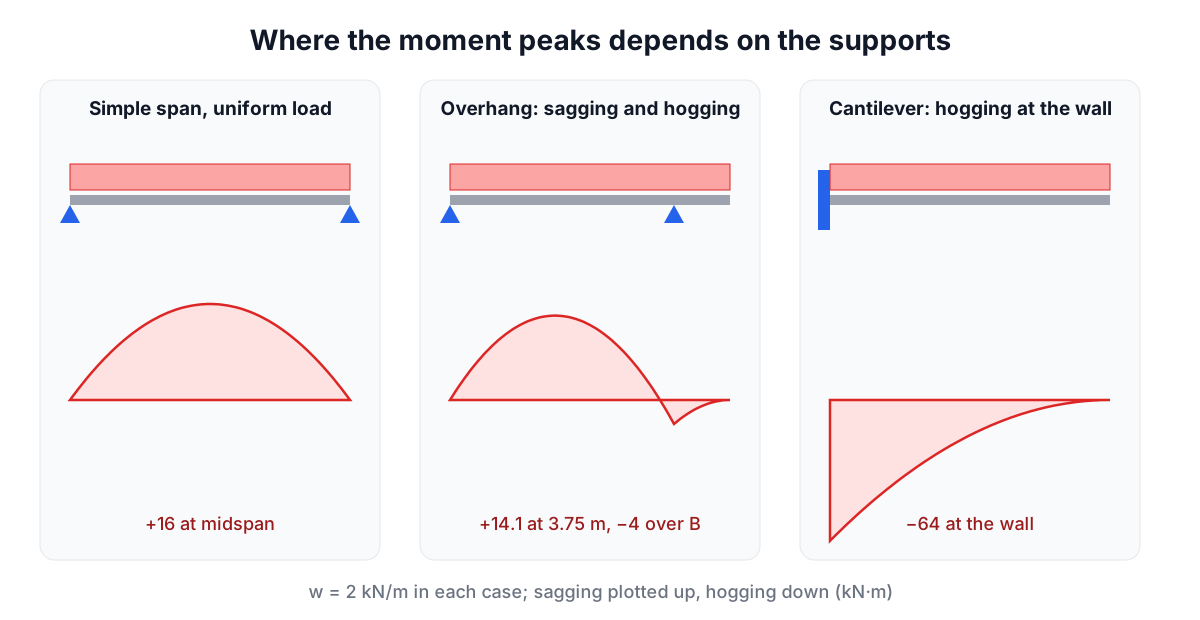
Move a support inward and things change. A 10 m beam with supports at 0 and 8 m and 2 kN/m everywhere has reactions of 7.5 kN and 12.5 kN. The sagging moment peaks at 14.06 kN·m at 3.75 m, but over support B the 2 m overhang produces a hogging moment of −2 x 2² / 2 = −4 kN·m, and the shear jumps across zero at B as well. There are now two critical sections, and they put tension on opposite faces.
A cantilever has a single fixed support that provides both a force and a moment. For a 3 m cantilever with 4 kN/m and a 2 kN tip load, the wall reaction is 14 kN and the fixed-end moment is wL²/2 + PL = 18 + 6 = 24 kN·m, hogging. The whole moment diagram is negative and largest at the root, which is why cantilever brackets are deepest at the wall.
Common mistakes
Assuming the maximum is at midspan. It is only there for symmetric loading. In the first example it is at 4.5 m, not 4 m. Always find the zero-shear point.
Using the full UDL resultant inside a cut. When the cut is part way through a distributed load, only the portion to the left of the cut counts, and its resultant acts at the middle of that portion.
Forgetting the reaction moment at a fixed end. A cantilever wall reaction is a force and a couple. Leaving out the couple makes the moment at the tip non-zero, which is an instant sign of an error.
Mixing service and factored loads. For LRFD or Eurocode design, factor the loads first (for example 1.2D + 1.6L, or 1.35G + 1.5Q) and draw the diagrams for the factored case. For deflection, use service loads.
Closure. The moment at a free end or at a pin at the end of the beam must come back to zero. If your diagram does not close, an arithmetic error is hiding somewhere.
Where the simple method stops
Everything above assumes a statically determinate beam: a simple span, a beam with overhangs or a cantilever. A beam continuous over three supports, or a propped cantilever, has more unknown reactions than equilibrium equations. Those need compatibility of deflections (the three-moment equation, moment distribution or a stiffness-method program), and the answer depends on the relative stiffness of the spans.
Once you have the diagrams, the next steps are section checks. The maximum moment divided by the section modulus gives the bending stress, and the Section Properties Calculator supplies S for common shapes, with background in the guide to moment of inertia and section modulus. Deflection is the integral of M/EI, covered in the beam deflection formulas guide and the Beam Deflection Calculator. Columns that carry the reactions down to the foundations are checked for buckling in the Column Buckling Calculator.
Diagrams and reactions from this method are the start of a design, not the end of one. Members that carry people or property should be designed or checked by a qualified engineer against the governing code.