
Stock Valuation Basics: P/E, P/B, DCF and a Written Thesis
What P/E, EPS, P/B and dividend yield really measure, a per-share DCF worked by hand, where each method breaks, and how to turn the numbers into a written thesis.
· 7 min read
At 185.25 a share and earnings of 6.50 a share, Apple traded at 28.5 times earnings in the sample data the Stock Analysis Calculator ships with. Run a plain discounted earnings model at a 10% discount rate, give the company 11% earnings growth for five years, and it values the share at about 126. Even at 20% growth for five years the model only reaches about 180. The market price is not necessarily wrong. It is telling you that buyers expect more growth, for longer, or will accept a lower return than 10%. Reading valuation numbers that way, as statements about expectations rather than verdicts, is the useful skill.
This guide covers the ratios on the calculator's Valuation and Fundamentals tabs, works a per-share DCF by hand, shows where each method breaks, and then turns the numbers into a written thesis with the Investment Thesis Analyzer. It is educational material, not a recommendation to buy or sell anything.
The core ratios
Most valuation ratios compare the share price with one line of the financial statements, expressed per share.
| Ratio | Formula | Apple sample | What it tells you |
|---|---|---|---|
| EPS | Net income / shares outstanding | 6.50 | Profit attributable to one share over the last 12 months |
| P/E | Price / EPS | 28.5 | Dollars paid per dollar of annual earnings |
| P/B | Price / book value per share | 12.8 | Price relative to accounting net assets |
| Dividend yield | Annual dividend / price | about 0.5% | Cash income per dollar invested |
| ROE | Net income / shareholders' equity | 45.6% | Profit generated on the equity on the books |
A few practical notes on each:
- P/E is only meaningful when earnings are positive. A company losing money has no useful P/E, which is why the calculator shows 0 in that case. Compare P/E within an industry and against the company's own history, not across sectors.
- P/B works well for banks and insurers whose assets are mostly financial and marked close to market value. For software and consumer brands, the real assets (code, brands, customer relationships) barely appear on the balance sheet, so P/B looks absurd.
- Dividend yield rises when the price falls. A sudden 9% yield is more often a warning that the market expects a dividend cut than a bargain.
- ROE can be flattered by debt and by share buybacks that shrink equity. Read it next to debt-to-equity.
Growth over several years is best measured as a compound annual growth rate: CAGR = (end / start)^(1 / years) − 1. EPS that doubles in ten years has grown at (2)^(0.1) − 1 = 7.18% a year, not 10%.
A per-share DCF, worked by hand
A discounted cash flow model values a share as the present value of what it will earn for its owners. The calculator uses earnings per share as a stand-in for free cash flow per share (the free data source does not provide cash flow) and a two-stage model:
- Grow EPS at a chosen rate for five years.
- Discount each year's EPS back to today at 10%.
- After year five, assume EPS grows 2.5% forever and value that stream with the Gordon growth formula: terminal value = EPS₅ × 1.025 / (0.10 − 0.025).
- Discount the terminal value back five years and add it to step 2.
For EPS of 5.00 growing 8% a year:
| Year | EPS | Discount factor | Present value |
|---|---|---|---|
| 1 | 5.400 | 1 / 1.10 | 4.909 |
| 2 | 5.832 | 1 / 1.21 | 4.820 |
| 3 | 6.299 | 1 / 1.331 | 4.732 |
| 4 | 6.802 | 1 / 1.4641 | 4.646 |
| 5 | 7.347 | 1 / 1.61051 | 4.562 |
The five years are worth 23.67 today. The terminal value is 7.347 × 1.025 / 0.075 = 100.40, which is worth 100.40 / 1.61051 = 62.34 today. Total: 86.01.
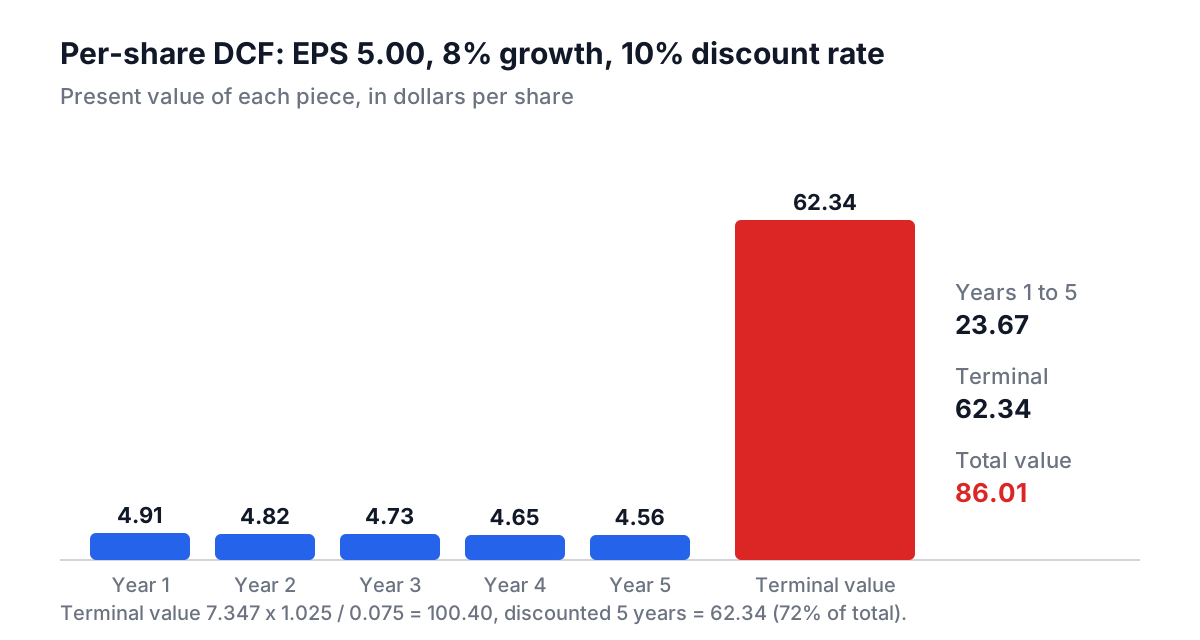
Notice that 72% of the value sits in the terminal value. That is normal, and it is the model's weak point: the result depends heavily on the gap between the discount rate and the long-run growth rate. Raise terminal growth from 2.5% to 3.5% and the terminal value rises by about 16%. Small changes to assumptions you cannot know produce large changes in "fair value".
The calculator clamps growth between −10% and 20% because the figure it receives is one quarter's year-on-year earnings change, which can be 80% for a company recovering from a bad year. Feeding that into five years of compounding produces nonsense.
Three methods, three blind spots
The calculator averages three estimates. For the Apple sample:
| Method | Assumption | Value |
|---|---|---|
| Discounted earnings | 11% growth, 10% discount rate | 126.34 |
| P/E-based | Fair P/E of 20 | 130.00 |
| P/B-based | Fair P/B of 2.5 | 36.18 |
| Average | 97.51 |
Against a price of 185.25, the average implies −47%. The P/B estimate drags the average down because Apple's book value is small relative to its earnings power. For a bank, P/B would be the most informative of the three and the DCF the least, because a bank's "cash flow" is hard to define.
The lesson is to read each estimate with the business model in mind and to ask what the price implies. Here, no growth rate the model allows gets to 185; the market is pricing in a longer period of high growth, a lower required return, or both. Whether that is reasonable is a judgment the numbers cannot make for you.
From numbers to a written thesis
A thesis is the argument for owning a stock, written down so that you can check it later. The numbers above supply one part of it, the price you are paying for an expected stream of earnings. The other parts are qualitative, and that is where the Investment Thesis Analyzer helps. It scores a weighted checklist drawn from well-known investors:
| Source | Questions | Weight |
|---|---|---|
| Warren Buffett | Understandable business, durable moat, honest management, predictable cash flow | 4 to 5 each |
| Charlie Munger | Wonderful business at a fair price, avoiding psychological biases | 3 to 4 |
| Peter Lynch | One-sentence story, room to grow, PEG below 1 | 3 to 4 |
| Mohnish Pabrai | Limited downside, low capital needs, niche leadership | 3 to 4 |
| General | Balance sheet, dividend sustainability, market valuation | 2 to 3 |
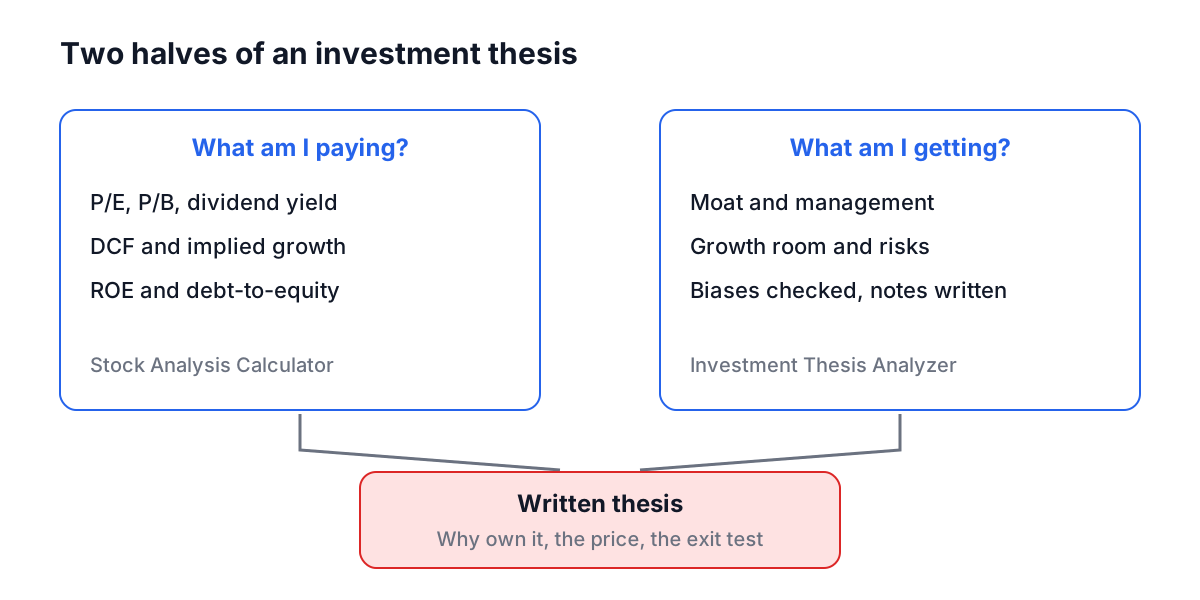
The stock checklist is worth 53 points. Unticked questions count as no, so the score moves as you work. The valuation question, "Is the P/E reasonable relative to growth (PEG < 1)?", links straight back to the numbers: PEG is P/E divided by the growth rate in percent. Apple's 28.5 P/E on 11% growth gives a PEG of about 2.6, so a careful answer is no.
For ETFs the analyzer switches to seven questions about the index, expense ratio, liquidity, tracking error and fit. The ETF fees and dividends guide explains why the expense ratio question deserves its 4-point weight.
Common mistakes
- Treating fair value as a target price. It is the output of fixed assumptions. Change the discount rate and it moves.
- Comparing P/E across industries. Utilities and software companies should not trade at the same multiple.
- Ignoring negative earnings. Earnings-based methods return zero for loss-making companies; use revenue multiples or a cash flow forecast instead.
- Chasing yield. A high dividend yield is often a falling price in disguise.
- Ticking boxes without notes. A checklist answer you cannot justify in one sentence is a guess.
- Trusting demo data. Without an Alpha Vantage key, the calculator generates random simulated numbers. They are for exploring the layout only.
A practical routine
Pull the company into the Stock Analysis Calculator with your free Alpha Vantage key and note the P/E, P/B, ROE, debt and the three value estimates. Ask which estimate fits the business model and what growth the current price implies. Then open the Investment Thesis Analyzer, answer every question with a note, and download the report. Six months later, re-read it before you look at the share price. To measure how the holding actually performed, including any money you added along the way, use the Investment Returns Calculator.