
Estimating Horsepower from Quarter-Mile ET and Trap Speed
Where the Hale, Fox and Huntington constants come from, why trap speed is a better power gauge than elapsed time, how drivetrain loss links wheel and crank figures, and how hp, kW and PS relate.
· 10 min read

A drag strip timeslip is a cheap dynamometer. Weigh the car, run the quarter mile, and the elapsed time (ET) and trap speed together say a good deal about how much power the engine makes. The formulas that turn a timeslip into horsepower are empirical, built from fitting curves to real cars, and they come in three main flavours that give noticeably different answers. This post explains where they come from, why trap speed is the better of the two inputs, how to move between wheel and crank power without the most common arithmetic slip, and how horsepower, kilowatts and PS relate. All the numbers can be reproduced in the Horsepower Calculator.
Why power-to-weight sets the quarter mile
Start with an idealised car that delivers constant power P to the road from the moment it launches, with no drag, no wheelspin and no gear changes. Kinetic energy rises at the rate P, so
½ m v² = P t → v = √(2 P t / m)
Integrating speed over time to get distance, and setting the distance to a quarter mile (402.336 m), gives two clean results:
ET  ∝ (m / P)^(1/3)
v   ∝ (P / m)^(1/3)
Both depend only on the power-to-weight ratio, and both through a cube root. That cube root is the shape of every quarter-mile formula. It also explains why big power gains produce small time gains: doubling power-to-weight cuts ET by only 21 percent, because 2^(1/3) = 1.26.
With weight in pounds and power in horsepower, the ideal constant-power car would run
ET  = 4.80 x (W / P)^(1/3)
mph = 281  x (P / W)^(1/3)
Real cars are slower than this. Launches are limited by traction rather than power, the engine only makes peak power over part of its rev range, gear changes interrupt the drive, and aerodynamic drag and rolling resistance take a growing share at speed. The empirical formulas absorb all of that into larger ET constants and smaller speed constants.
Hale, Fox and Huntington
Three sets of constants are in common use. Each has the same form:
ET  = c_ET  x (W / P)^(1/3)
mph = c_mph x (P / W)^(1/3)
where W is the race weight in pounds including the driver and P is engine horsepower at the flywheel, as quoted by the manufacturer (net, not wheel horsepower).
| Model | ET constant | mph constant | Origin |
|---|---|---|---|
| Huntington | 6.290 | 224 | Roger Huntington, 1950s, drawn from cars of that era |
| Fox | 6.269 | 230 | Geoffrey Fox, a refinement of Huntington's fit |
| Hale | 5.825 | 234 | Patrick Hale, 1980s, widely used in quarter-mile software |
Attribution of these constants varies between sources, and none of them is a law of physics. They are curve fits to the cars their authors had data for. Hale's set, being the most recent, tends to match modern street cars with good tyres best, which is why the calculator uses it by default and offers the other two for comparison.
Comparing the empirical constants with the ideal ones is instructive. Hale's 234 mph against an ideal 281 implies the car behaves as if about 58 percent of its rated power went into accelerating it on average over the run. Hale's ET constant implies a similar figure, about 56 percent. Wheel losses, drag, shifts and the shape of the power curve account for the rest.
Trap speed is the better gauge
ET depends heavily on the first 60 feet. A car that spins its tyres, bogs off the line or has a slow reaction to the launch can lose half a second without the engine being any weaker. Trap speed, measured over the last stretch before the finish, is set mostly by how hard the car is pulling at the top end, when traction is no longer the limit. So for estimating power, the trap speed formula is far less sensitive to driver and tyres.
Worked example, a 3,500 lb car (with driver) that runs 12.0 seconds at 112 mph:
From ET (Hale):    P = 3,500 x (5.825 / 12.0)³ = 400.3 hp
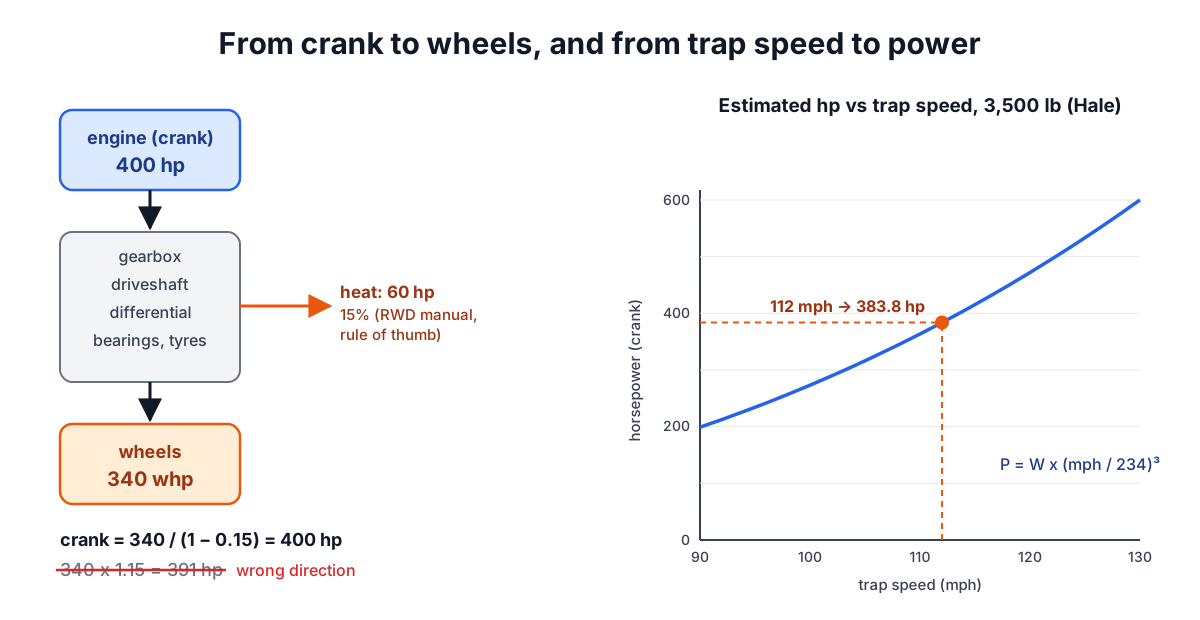
From mph (Hale):   P = 3,500 x (112 / 234)³    = 383.8 hp
From ET (Fox):     P = 3,500 x (6.269 / 12.0)³ = 499.0 hp
From mph (Fox):    P = 3,500 x (112 / 230)³    = 404.1 hp
From ET (Huntington):                            504.1 hp
From mph (Huntington):                           437.5 hp
Two things stand out. Hale's two estimates agree within 5 percent, and the trap speed estimates from all three models are closer together than the ET estimates. The ET formulas are cubed, so the spread between 5.825 and 6.29 turns into a 26 percent spread in power. If the ET and trap speed estimates disagree sharply for one car, the launch is usually the reason: a strong trap with a slow ET says the power is there and the car is not hooking.
Running the formulas forwards, 400 hp in a 3,500 lb car predicts 12.00 seconds at 113.6 mph with Hale's constants, or 12.92 seconds at 111.6 mph with Fox's.
Wheel horsepower, crank horsepower and drivetrain loss
Manufacturer ratings are measured at the crankshaft (or flywheel) on an engine dynamometer. A chassis dyno measures power at the driven wheels, after the gearbox, driveshaft, differential, wheel bearings and tyres have each taken a share as heat. The difference is drivetrain loss.
The calculator offers rule-of-thumb presets:
| Layout | Typical loss |
|---|---|
| Front-wheel drive, manual | 12% |
| Rear-wheel drive, manual | 15% |
| Rear-wheel drive, automatic | 18% |
| All-wheel drive | 22% |
These are approximations used across the hobby, not measured values for any particular car. Real losses vary with the gearbox, the oil temperature, the tyre pressure, the gear used for the pull and the type of chassis dyno, and the same car can read differently on two dynos on the same day.
The arithmetic trap is the direction of the percentage. Loss is a fraction of crank power, so
wheel = crank x (1 − loss)
crank = wheel / (1 − loss)
A car making 340 wheel horsepower with a 15 percent loss has 340 / 0.85 = 400 crank horsepower. Check it: 400 x 0.85 = 340. The tempting shortcut, 340 x 1.15 = 391, is wrong, because 15 percent of 391 is not 51. The error grows with the loss: at 22 percent, 340 whp is 436 crank hp, not 415.
There is also a modelling question. Part of drivetrain loss is roughly fixed (oil churning, seal drag) rather than proportional to power, so a percentage overstates the loss on a heavily modified engine. Treat converted figures as estimates and compare like with like: wheel against wheel on the same dyno is the most reliable comparison.
The quarter-mile formulas were fitted against rated crank horsepower, so their output is an estimate of crank power. Multiply by (1 − loss) to compare with a chassis dyno sheet.
Horsepower, kilowatts and PS
Three power units appear on spec sheets:
- Horsepower (hp), also called mechanical or imperial horsepower: 550 ft·lbf per second, which is 745.70 W. This is the unit in US ratings.
- Kilowatts (kW): the SI unit and the legal unit for vehicle power in the EU and many other countries.
- PS (Pferdestärke), also called metric horsepower, CV or ch: 75 kgf·m per second, which is 735.50 W. It is about 1.4 percent smaller than the mechanical horsepower.
1 hp = 0.7457 kW = 1.0139 PS
1 kW = 1.3410 hp = 1.3596 PS
1 PS = 0.9863 hp = 0.7355 kW
So a European car quoted at 300 PS makes 295.9 hp, and a 200 kW engine is 268.2 hp or 271.9 PS. When an engine makes 300 lb-ft at 6,000 rpm, its output is 342.7 hp, 255.6 kW or 347.5 PS. The torque-to-power relation behind that first number, including where the 5,252 comes from, is covered in the post on the torque, horsepower and rpm formula, and the Torque and Power Calculator converts torque units.
Older US ratings add one more trap. Before the 1972 model year, American manufacturers quoted SAE gross horsepower, measured on a bare engine without accessories or a production exhaust. Net ratings, taken with the engine as installed, are substantially lower for the same engine. Using a gross figure from an old brochure in the quarter-mile formulas will make a classic car look slower than it should be.
Common mistakes
- Leaving out the driver. W is race weight. A 180 lb driver in a 3,320 lb car changes the estimate by about 5 percent.
- Feeding wheel horsepower into the predicted ET. The constants assume crank power. Wheel figures predict a car that is too slow.
- Multiplying by (1 + loss) to get crank power. Divide by (1 − loss).
- Trusting ET from a poor launch. Use trap speed, or the best of several runs.
- Ignoring altitude and weather. Thin, hot air costs a naturally aspirated engine power. Drag strips report corrected times for that reason.
When the simple model breaks down
The formulas assume a typical street car: rear or front drive, sensible gearing, street or drag radial tyres, roughly stock aerodynamics. They drift for cars far outside that envelope. Very light, very powerful cars and motorcycles are traction-limited for much of the run, so ET estimates are poor. Electric cars have strong low-speed torque and no gear changes, so they run quicker ETs than their power suggests and the ET-based estimate overstates their power. Cars with poor aerodynamics lose more at the top end, which pulls the trap speed down. Long gearing that leaves the engine below peak power at the finish line does the same.
Use the results as a calibrated estimate, a way to compare changes on the same car, and a sanity check against a dyno sheet, not as a replacement for a dyno. For the engine side, see the posts on engine displacement, bore and stroke and static and dynamic compression ratio. For gearing that keeps the engine near peak power through the traps, see road speed from rpm, gear ratio and tyre size and the Gear Speed Calculator.