
Stock Average Price in India: Charges, Break-even, Averaging
Find the average buy price of a share in rupees with STT, stamp duty and other delivery charges, the real break-even, and how many shares it takes to average down.
By Redbison Dev · · 9 min read
India edition. Written for Indian investors: rupees with lakh grouping, the charges on an NSE delivery trade (STT, stamp duty, exchange and SEBI fees, GST, DP charge) from a published broker schedule, booked and unbooked profit, and the capital gains rules for listed shares after the 2024 Budget. US edition
If you bought the same share on NSE or BSE more than once, your average price is the total amount you paid, charges included, divided by the shares in your demat account. Your broker's holdings screen shows a version of it, which may leave out the STT, stamp duty and other charges on your contract notes; that is why the price you need to break even is a little higher than the average on screen. This edition shows the calculation with a real published charge schedule, the break-even after selling charges, how many shares it takes to average down, and what the capital gains rules mean for a sale. Every figure comes from the Stock Average Calculator (India).
The charges on a delivery trade
Charges differ by broker, so use your own contract note. As an example, Zerodha's published charges for equity delivery list:
| Charge | Rate | Side |
|---|---|---|
| Brokerage | ₹0 | |
| STT | 0.1% | buy and sell |
| Stamp duty | 0.015% (₹1,500 per crore) | buy |
| NSE transaction charge | 0.00307% | buy and sell |
| SEBI fee | ₹10 per crore | buy and sell |
| GST | 18% on brokerage, SEBI and transaction charges | buy and sell |
| DP charge | ₹15.34 per scrip | sell |
This is one broker's schedule, quoted to show how the charges add up, not a recommendation. Check every line against your own contract note, especially brokerage and the DP charge.
Worked example: two buys
You buy 100 shares at ₹2,450 and later 60 more at ₹2,180, both on NSE for delivery. Applying the schedule above:
| Buy | Value | STT | Stamp | Txn + SEBI | GST | Total charges |
|---|---|---|---|---|---|---|
| 100 x ₹2,450 | ₹2,45,000 | ₹245.00 | ₹36.75 | ₹7.77 | ₹1.40 | ₹290.91 |
| 60 x ₹2,180 | ₹1,30,800 | ₹130.80 | ₹19.62 | ₹4.15 | ₹0.75 | ₹155.31 |
Totals are worked from unrounded components, so a row can differ from the sum of its rounded cells by a paisa.
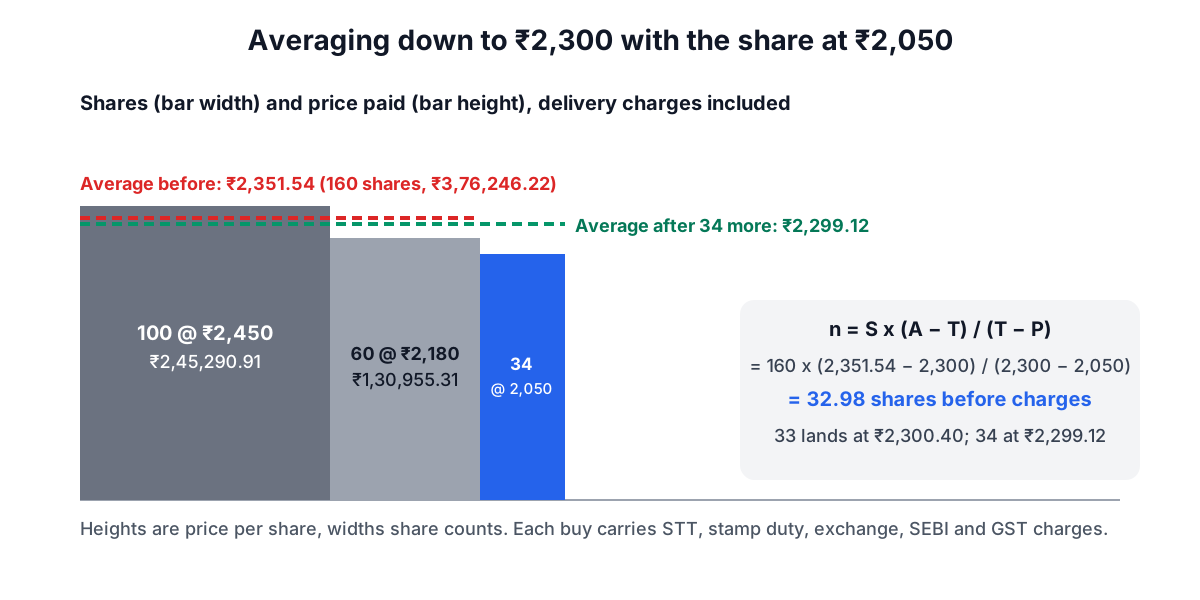
Enter both buys with their total charges in the fee box. The calculator returns 160 shares, total cost ₹3,76,246.22, average ₹2,351.54. Without charges the average would be ₹2,348.75, so charges add about ₹2.79 a share, roughly 0.12%.
The average is weighted by quantity. The simple average of the two prices, (₹2,450 + ₹2,180) / 2 = ₹2,315, is wrong here because more money went in at ₹2,450.
The real break-even price
To get your money back you must sell at a price that covers the total cost and the selling charges. Selling all 160 shares at around the average price, the schedule gives selling charges of about ₹405.66 (STT of 0.1% is most of it, plus the ₹15.34 DP charge), so:
break-even = (₹3,76,246.22 + ₹405.66) / 160 = ₹2,354.07
The broker's screen may show ₹2,348.75 as your average and suggest you are in profit at ₹2,350. After charges in and out, you are not until about ₹2,354. On a smaller holding the gap is larger, because the ₹15.34 DP charge is per scrip, not per share.
At today's price of ₹2,050, the holding is worth ₹3,28,000 against ₹3,76,246.22 of cost: an unbooked loss of ₹48,246.22, or 12.8%.
How many shares to average down
With the share at ₹2,050, how many more do you need to bring the average to ₹2,300? The formula, for S shares at average A, price P and target T, is:
n = S x (A − T) / (T − P) = 160 x (2,351.54 − 2,300) / (2,300 − 2,050) = 32.98
Shares trade in whole units, and the new buy carries its own charges. Buying 33 shares (₹67,650 plus ₹80.33 of charges) lands the average at ₹2,300.40, just above the target; 34 shares takes it to ₹2,299.12.
The closer the target is to the market price, the faster the money needed grows:
| Target average | Shares to buy at ₹2,050 | Approximate outlay before charges |
|---|---|---|
| ₹2,300 | 33 to 34 | ₹67,650 to ₹69,700 |
| ₹2,250 | 82 | ₹1,68,100 |
| ₹2,200 | 162 | ₹3,32,100 |
| ₹2,100 | 805 | ₹16,50,250 |
Getting to ₹2,200 needs almost as much new money as the whole original position, and ₹2,100 needs more than four times it. Averaging down is a decision about whether the company is worth more than ₹2,050, not about the average: a lower average makes recovery look closer but puts more of your money into one stock.
Selling part of the holding
The calculator handles a sale by taking shares out at the current average, so the average of the remaining shares does not change; the difference between sale proceeds (after charges) and the average cost of the shares sold is your booked profit or loss. Your broker's tax P&L statement may work out the cost of each sale lot by lot instead, so for tax use that statement, not this average.
Capital gains on listed shares
The memorandum to the Finance (No. 2) Bill, 2024, presented with the July 2024 Budget, explains the changes for listed equity shares on which STT is paid. The sources cited here cover sales up to 31 March 2026 (AY 2026-27) and use the section numbers of the Income Tax Act, 1961:
- Holding period. Gains on listed securities are long-term after 12 months, short-term within 12 months.
- Short-term gains (section 111A): taxed at 20%, up from 15%.
- Long-term gains (section 112A): taxed at 12.5%, with gains up to ₹1.25 lakh a year exempt (up from ₹1 lakh).
The filing form depends on the gains. The Income Tax e-filing portal says, for AY 2026-27, that ITR-1 covers long-term capital gains under section 112A only up to ₹1,25,000 and cannot be used if you have short-term capital gains. For a sale made after 31 March 2026, check the rates, exemption limit and section numbers for that year on the e-filing portal before you file.
The e-filing portal's guide for senior citizens also notes that the surcharge on income under sections 111A, 112 and 112A is capped at 15%.
Each purchase has its own date, so in a holding built up over time some shares may be long-term and others short-term. A chartered accountant can help if your gains are large or your trades are frequent.
Tools for this job
- Stock Average Calculator (India): average price, break-even and averaging down in rupees.
- SIP Calculator: what regular investing in a fund adds up to, as an alternative to adding to one stock.
- ROI Calculator: the return on everything you have put in.
- Dividend Calculator: the income from the shares you hold.
Frequently asked questions
Does the average price on my broker app include STT and stamp duty?
Check. If the screen shows the plain average of your trade prices (₹2,348.75 in the example), it has left the charges out. Add the charges from your contract notes to get the true cost; in the example they add about ₹2.79 a share.
Why is my break-even higher than my average price?
Because selling has charges too: 0.1% STT, exchange and SEBI fees with GST, and a DP charge per scrip. On 160 shares averaging ₹2,351.54, break-even is about ₹2,354.07.
How many shares should I buy to reduce my average?
Shares held x (average − target) / (target − price), then round up and allow for the new buy's charges. From 160 shares at ₹2,351.54, reaching ₹2,300 at ₹2,050 takes 34 shares.
Is long-term capital gain on shares tax free up to ₹1.25 lakh?
Under section 112A, long-term gains on STT-paid listed equity up to ₹1.25 lakh a year are exempt and the rest is taxed at 12.5%, as explained in the 2024 Budget memorandum; the e-filing portal's ITR-1 guidance for AY 2026-27 uses the same ₹1,25,000 limit. Short-term gains under section 111A are taxed at 20%. These figures are for sales up to 31 March 2026; check the current year's rates and section numbers on the e-filing portal for later sales.
Sources and further reading
- Brokerage and charges, Zerodha. Published equity delivery charges: STT, stamp duty, NSE and BSE transaction charges, SEBI fee, GST and DP charge. One broker's schedule, used as an example.
- Memorandum explaining the provisions in the Finance (No. 2) Bill, 2024, Ministry of Finance. 12-month holding period for listed securities, 20% under section 111A, 12.5% under section 112A and the ₹1.25 lakh exemption.
- Returns and forms applicable for salaried individuals, AY 2026-27, Income Tax Department. ITR-1 limit for section 112A gains and the bar on short-term gains.
- Senior citizens and super senior citizens, AY 2026-27, Income Tax Department. ITR-1 limits and the 15% cap on surcharge for income under sections 111A, 112 and 112A.
- Weighted arithmetic mean, Wikipedia. Why the average price is weighted by quantity.
Open the Stock Average Calculator
More Calculators
Every tool in the Calculators section, free and in your browser.
- Investment Calculator
- Compound Interest Calculator
- Simple Interest Calculator
- Interest Calculator
- EMI Calculator
- Retirement Calculator
- Time-Weighted Return Calculator
- Savings Goal Calculator
- Inflation Calculator
- CAGR Calculator
- ROI Calculator
- Present and Future Value Calculator
- NPV and IRR Calculator
- 401(k) Calculator
- Roth IRA Calculator
- APY and CD Calculator
- SIP Calculator
- Annuity Calculator
- Bond Price and Yield Calculator
- Currency Converter
- Dividend Calculator
- Stock Average Calculator
- RMD Calculator