
Lump Sum vs Monthly Investing: Pound-Cost Averaging
Lump sum or monthly investing in a UK ISA or pension: what the maths in pounds shows, how pound-cost averaging works, and how ISA allowances change the timing.
By Redbison Dev · · 6 min read
United Kingdom edition. Written for UK investors: the Indian SIP idea as regular monthly investing, examples in pounds, the £20,000 ISA allowance and its 5 April deadline, pension contributions and tax relief, general account tax allowances, and UK research on phasing a lump sum. US edition
Put the full £20,000 ISA allowance into a global fund on 6 April and, at a steady 5% a year, it is worth £32,577.89 after ten years. Feed the same £20,000 in at £1,666.67 a month over the tax year and it is worth £31,879.84. Investing at once wins by about £700 when markets rise steadily, and Vanguard's research covering 1976 to 2022 found a lump sum beat spreading the money out in 61.6% to 73.7% of rolling one-year periods, depending on the market. Yet "phase it in" remains common advice in the UK, and for some people it is the right call. This edition shows both sides with figures in pounds.
In India this question is framed as "SIP versus lump sum"; in the UK it is usually regular monthly investing, drip-feeding or pound-cost averaging. The figures come from the UK investment calculator, which projects monthly investing or a lump sum at a steady return. It is arithmetic, not a recommendation of any fund or platform.
How each option is calculated
Monthly investing treats each payment as invested at the start of its month, then growing for the months that remain. The total is the future value of an annuity due:
FV = P × [((1 + i)^n − 1) / i] × (1 + i)
with P the monthly amount, i the yearly return divided by 12 and n the number of months. £300 a month for 20 years at 5% gives £123,823.89 from £72,000 paid in.
A lump sum compounds yearly for the whole term: Value = Amount × (1 + rate)^(months / 12). £20,000 at 5% for 120 months gives £32,577.89.
To compare phasing with investing at once, run the monthly amount for the phasing period, then let that value grow as a lump sum for the rest of the term. That is how the figures below were produced.
Phasing in a year's ISA allowance
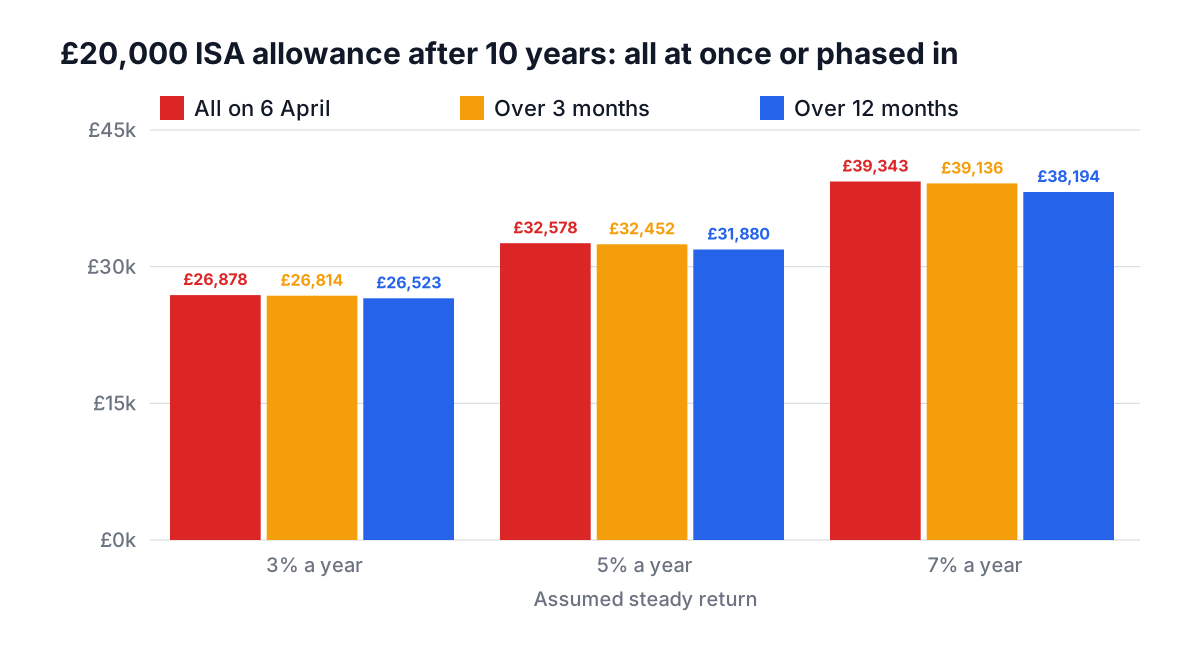
| Steady return | All on 6 April | Over 3 months | Over 12 months |
|---|---|---|---|
| 3% a year | £26,878.33 | £26,814.06 | £26,523.43 |
| 5% a year | £32,577.89 | £32,451.87 | £31,879.84 |
| 7% a year | £39,343.03 | £39,136.21 | £38,193.61 |
Two patterns stand out. The longer you phase, the more you give up in a rising market, because money waiting in cash is not invested. And a short phase-in costs little: three months gives up £126.02 at 5%, while twelve months gives up £698.05. Vanguard's study found the same shape across markets, including the UK's FTSE All-Share: the longer the cost-averaging period, the bigger the shortfall on average.
The calculator's two modes compound slightly differently (monthly for regular investing, yearly for a lump sum), which flatters the phased options a little. The gap would be a bit larger with identical compounding.
Why people still phase in
The steady-return model hides the case phasing is designed for: a fall soon after you invest. If £20,000 went in on 6 April and markets fell 20% by the summer, the whole sum takes the loss; a monthly investor would still have most of the money in cash and would buy more units at lower prices. Vanguard puts it the other way round: cost averaging did better in the minority of periods when markets fell early. Nobody knows in advance which period they are in.
Phasing is therefore a trade: a lower expected result in exchange for less regret if markets fall early. If a big early fall would make you sell, which locks in the loss, a three- to six-month phase-in can be the better plan for you even though it is not the better average.
Pound-cost averaging in practice
Regular monthly investing buys more units when prices are low and fewer when they are high:
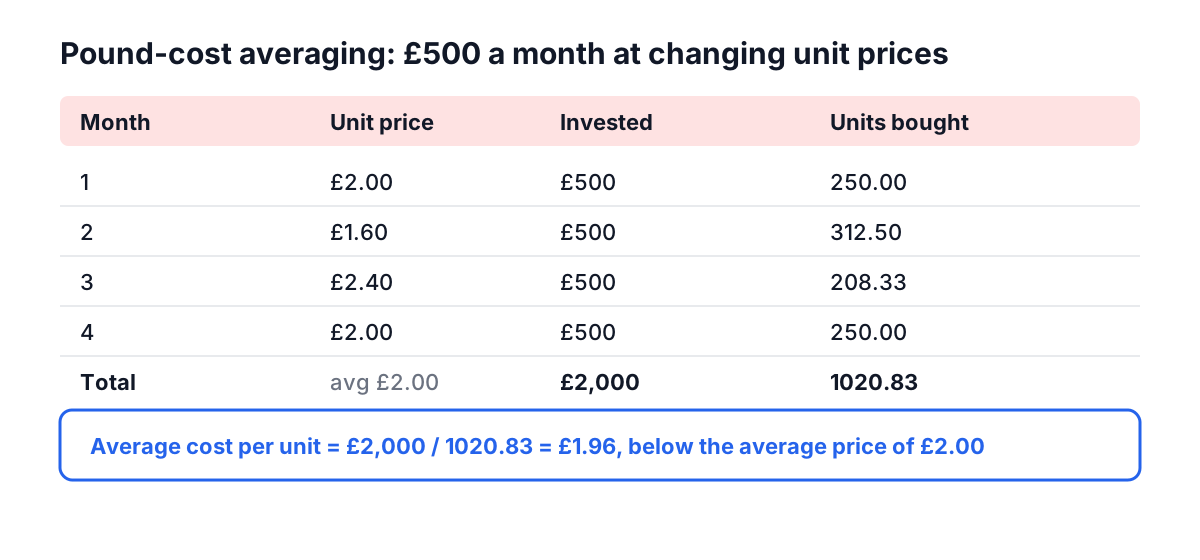
The average cost per unit (£1.96) is below the average price (£2.00) because the cost is the harmonic mean of the prices. The benefit is modest and only appears when prices move around; in a market that rises every month, it does nothing.
For most people, pound-cost averaging is not a choice but how money arrives: monthly pay. If you invest what is left each month, the lump sum comparison does not apply. The relevant question is what the habit becomes, and the UK savings goal calculator and UK investment calculator answer it.
UK rules that change the timing
ISA allowances: use it or lose it
In the 2026 to 2027 tax year you can pay up to £20,000 into ISAs in total. The allowance does not carry forward: what you do not use by 5 April is lost. That makes the UK version of this question different from the simple maths. Someone who inherits £60,000 cannot shelter it all at once; it takes three tax years at £20,000 each, assuming no other ISA payments. If the money arrives in March, £20,000 can go in before 5 April and another £20,000 from 6 April, sheltering £40,000 within weeks. Money that is not yet in an ISA can wait in cash or, if invested in a general investment account, be moved into the ISA each April.
From 6 April 2027 the cash ISA limit for under-65s falls to £12,000; the overall £20,000 limit and stocks and shares ISAs are unchanged.
Outside an ISA: the general investment account
Gains and income in a general investment account are taxable. In the 2026 to 2027 tax year, GOV.UK lists a dividend allowance of £500, with dividends above it taxed at 10.75%, 35.75% or 39.35% depending on your band, and a Capital Gains Tax annual exempt amount of £3,000. A large lump sum invested outside an ISA can produce taxable dividends from the first year, which is one more reason to move it into ISAs as the allowance allows.
Pensions: monthly by default, lump sums allowed
Workplace pensions are pound-cost averaging by design: contributions leave each payslip with your employer's added. Personal pension contributions get tax relief; with relief at source, £80 from you becomes £100 in the pension. You can also pay a lump sum, within the annual allowance of £60,000 for the tax year (limited to your earnings for relief), with unused allowance carried forward from the previous three tax years. Pension money is locked until the normal minimum pension age, which rises from 55 to 57 on 6 April 2028.
A practical way to decide
- Money arriving monthly from pay: invest it monthly. Use the calculator to set the amount for your goal, and test 3%, 5% and 7%.
- A windfall for a goal at least 5 to 10 years away: the average favours investing it once it is in the right wrapper. If a fall soon after would make you sell, phase it over three to six months rather than a year.
- Money needed within a few years: keep it in cash or a fixed-rate bond; the UK compound interest guide covers AER and savings tax.
- Charges: enter a return after fund and platform charges. A 1% yearly charge comes straight off the return in every column above.
If you invest from the UK into Indian mutual funds by monthly SIP, the SIP calculator for NRIs in the UK covers HMRC's offshore fund rules. The US edition of this guide has the same maths without UK tax rules. For a large inheritance or pension decision, a regulated financial adviser can take account of your tax position and other savings.
Frequently asked questions
Is it better to invest a lump sum or drip-feed it monthly?
On average, investing at once has ended higher: Vanguard found lump sums beat cost averaging in between 61.6% and 73.7% of rolling one-year periods from 1976 to 2022, depending on the market. Drip-feeding does better when markets fall soon after you start. It mainly reduces regret, at a cost that grows with the length of the phasing.
Should I use my ISA allowance at the start of the tax year?
If you have the money, investing early in the tax year gives it longer in the market and longer sheltered from tax. £20,000 at a steady 5% is worth £32,577.89 after ten years if invested on 6 April, against £31,879.84 if paid in monthly over the year. Monthly payments suit people investing from their pay.
What is pound-cost averaging?
Investing a fixed amount at regular intervals, usually monthly. The same amount buys more units when prices are low and fewer when they are high, so your average cost per unit ends up below the average price. Four £500 purchases at £2.00, £1.60, £2.40 and £2.00 buy units at an average cost of £1.96.
How long should I take to phase in a lump sum?
There is no rule, but the cost of phasing grows with its length in a rising market. Over ten years at 5%, phasing £20,000 over three months gave up £126.02 against investing at once, and phasing over twelve months gave up £698.05. Vanguard's research reached the same conclusion: longer phasing, bigger average shortfall.
Can I pay a lump sum into my pension?
Yes. Personal contributions get tax relief within the annual allowance, which is £60,000 for the tax year, limited to your earnings for relief, and you may carry forward unused allowance from the previous three tax years. The money cannot normally be taken before the minimum pension age, rising from 55 to 57 on 6 April 2028.
Sources and further reading
- Individual Savings Accounts, GOV.UK. £20,000 ISA allowance for the 2026 to 2027 tax year.
- Reduction in the cash ISA limit, HM Revenue and Customs. £12,000 cash ISA limit for under-65s from 6 April 2027.
- Tax on dividends, GOV.UK. £500 dividend allowance and the 2026 to 2027 dividend tax rates.
- Capital Gains Tax: allowances, GOV.UK. £3,000 annual exempt amount.
- Tax on your private pension contributions: annual allowance, GOV.UK. £60,000 and carry forward from three previous tax years.
- Increasing normal minimum pension age, HM Revenue and Customs. 55 rising to 57 on 6 April 2028.
- The truth about cost averaging, Vanguard UK. Lump sum against cost averaging over rolling one-year periods, 1976 to 2022.
- 6.6 Methods of Savings, OpenStax. Future value of regular deposits.
Open the Investment Calculator
More Calculators
Every tool in the Calculators section, free and in your browser.
- Investment Calculator
- Compound Interest Calculator
- Simple Interest Calculator
- Interest Calculator
- EMI Calculator
- Retirement Calculator
- Time-Weighted Return Calculator
- Savings Goal Calculator
- Inflation Calculator
- CAGR Calculator
- ROI Calculator
- Present and Future Value Calculator
- NPV and IRR Calculator
- 401(k) Calculator
- Roth IRA Calculator
- APY and CD Calculator
- SIP Calculator
- Annuity Calculator
- Bond Price and Yield Calculator
- Currency Converter
- Dividend Calculator
- Stock Average Calculator
- RMD Calculator