
NPV and Discounting in Australia: the 7% Real Rate
Present value, NPV, BCR and IRR in A$ the way an Australian impact analysis does them: 7% real with 3% and 10% tests, real versus nominal, and CAGR on super.
By Redbison Dev · · 9 min read

Australia edition. Australian edition in A$, built on the Office of Impact Analysis requirement of a 7% real discount rate with 3% and 10% sensitivity tests, Treasury's cost-benefit guide and the RBA's 2 to 3% inflation target. US edition
A dollar today is worth more than a dollar in ten years, and for Australian Government proposals the exchange rate between the two is set by convention: the Office of Impact Analysis (OIA) requires net present values at an annual real discount rate of 7%, recalculated at 3% and 10% as a sensitivity test. If a proposal's NPV changes sign across those three rates, the OIA wants that said in the summary of the analysis. The same discounting sits behind every present value, IRR, CAGR and annualised ROI, whether the cash flows belong to a road upgrade or a super balance.
The examples use the Present and Future Value Calculator, the NPV Calculator (Australia), the CAGR Calculator and the ROI Calculator, in A$. They explain the maths and the government convention; nothing here is personal financial advice. The US version is here.
The OIA convention in three rules
- 7% central, 3% and 10% either side. The OIA's cost-benefit guidance note sets the 7% real rate and the two sensitivity rates. A footnote adds that the OIA will also accept a central real rate of 8% (as proposed by Mark Harrison's 2010 Productivity Commission paper), still tested at 3% and 10%.
- Real dollars. Analysts may in principle work in nominal or real terms, but the OIA note says converting everything to current dollars is usually simplest, and the rates are real. Constant-price forecasts go with the 7%.
- Report NPV and BCR. Treasury's evaluation guide on cost-benefit analysis (updated 2 July 2025) asks for both the net present value and the benefit-cost ratio, the present value of benefits divided by the present value of costs. A BCR above 1 means benefits outweigh costs.
Check your method against the OIA's own example
Box 1 of the OIA guidance note works through equipment that costs A$5 million to install and then has A$1 million a year of maintenance against A$3 million a year of benefits for four years, in constant prices. Net flows are -5, then 2, 2, 2 and 2 (A$ million). Enter those in the NPV calculator:
| Real discount rate | NPV (OIA Box 1) | NPV (calculator) |
|---|---|---|
| 3% | A$2.43m | A$2.434m |
| 7% | A$1.77m | A$1.774m |
| 10% | A$1.34m | A$1.340m |
The match confirms the convention: year 0 is undiscounted and each later year is divided by (1 + r)^t. The IRR of these flows is 21.86%, so no plausible rate would turn it negative.
A proposal that the 10% test catches
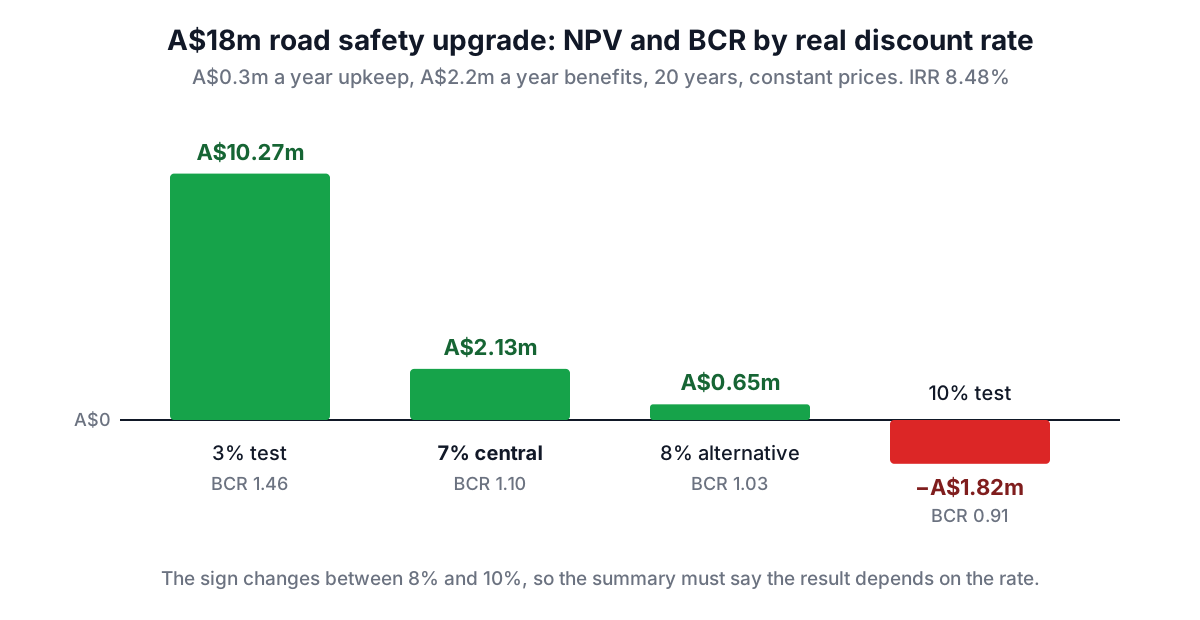
A road safety upgrade costs A$18 million now, then A$0.3 million a year to maintain, and is expected to avoid A$2.2 million a year of crash costs for 20 years (constant prices). Discount the benefit and cost streams separately to get the BCR, and the net flows for the NPV:
| Real rate | PV of benefits | PV of costs | NPV | BCR |
|---|---|---|---|---|
| 3% | A$32.73m | A$22.46m | A$10.27m | 1.46 |
| 7% (central) | A$23.31m | A$21.18m | A$2.13m | 1.10 |
| 8% (accepted alternative) | A$21.60m | A$20.95m | A$0.65m | 1.03 |
| 10% | A$18.73m | A$20.55m | -A$1.82m | 0.91 |
The IRR is 8.48%, so the NPV turns negative somewhere between the 8% and 10% rates. Under the OIA note this sign change is exactly what must be highlighted: the case is positive at the central rate but depends on the discount rate. Notice also that the BCR moves much less dramatically than the NPV, because the up-front A$18 million is never discounted while the benefits are.
The NPV calculator works on net flows. For a BCR, run the benefits stream and the costs stream through it separately (each with a 0 in year 0 where nothing happens) and divide the two present values.
Real and nominal, with the RBA target
The RBA's monetary policy framework targets consumer price inflation of 2 to 3% a year. If your forecasts are nominal, convert them or the rate, not both, and never by adding:
real rate = (1 + nominal) ÷ (1 + inflation) − 1
6% nominal at 2.5% inflation = 1.06 ÷ 1.025 − 1 = 3.41% real
A household version: A$10,000 left to grow for 30 years at an assumed 6% a year nominal becomes A$57,435. At 2.5% inflation (the midpoint of the RBA band) that is A$27,382 in current dollars, the same answer you get by compounding at the 3.41% real rate. Quoting the A$57,435 without the deflated figure makes long-term projections look about twice as good as they are in purchasing power.
CAGR versus a fund's average return
When returns are listed year by year, averaging them overstates growth. Take five hypothetical years of +12%, -4%, +9%, +15% and -2% on a A$100,000 balance with no contributions:
| Measure | Result |
|---|---|
| Ending balance | A$132,081 |
| Arithmetic average of the five returns | 6.00% |
| CAGR (geometric) | 5.72% |
Compounding A$100,000 at 6.00% for five years would give A$133,823, more than the fund actually reached. The CAGR Calculator takes a list of year-end balances and shows both numbers. With contributions and fees flowing in and out, as in a real super account, neither figure is your personal return; the Australian guide to time-weighted and money-weighted returns explains the difference between the fund's return and yours.
Annualised ROI uses the same root as CAGR, (1 + total return)^(1 ÷ years) − 1, so the 32.08% gain is 5.72% a year over five years but would be only 2.82% a year over ten.
Choosing the measure
- A government proposal: NPV and BCR at 7% real, with 3% and 10%, and a plain statement if the sign changes.
- A business investment: NPV at your own cost of capital, with IRR or MIRR to show the margin.
- A lump sum or regular saving: present and future value, with the rate matched to the payment period.
- Past growth of a balance: CAGR, never the average of yearly returns.
The Australian compound interest guide covers compounding frequency and effective rates.
Frequently asked questions
What discount rate does the Office of Impact Analysis require?
An annual real discount rate of 7% for net present values, with sensitivity calculations at 3% and 10%. The OIA guidance note also accepts a central real rate of 8% with the same 3% and 10% tests.
What happens if the NPV turns negative at 10%?
The analysis should say so prominently. The OIA note treats a change from net benefit to net cost across the 3%, 7% and 10% rates as evidence that the choice of discount rate matters, and asks for it to be highlighted in the summary.
How do I calculate a benefit-cost ratio?
Divide the present value of benefits by the present value of costs at the same rate. For the A$18 million road upgrade, that is A$23.31m ÷ A$21.18m = 1.10 at 7% real. A BCR above 1 means benefits exceed costs.
Should I use real or nominal dollars in a cost-benefit analysis?
Real (constant) dollars with the 7% real rate. The OIA notes that converting everything to current dollar terms is usually the simplest approach. If you only have nominal forecasts, deflate them or convert the rate with (1 + nominal) ÷ (1 + inflation) − 1.
Why is my super fund's average return higher than its CAGR?
Because an arithmetic average ignores compounding. Returns of +12%, -4%, +9%, +15% and -2% average 6.00%, but the balance grew at a compound 5.72% a year.
Sources and further reading
- Cost-benefit analysis guidance note, Office of Impact Analysis. The 7% real rate with 3% and 10% sensitivity, footnote 5 on the 8% alternative, and the Box 1 worked example.
- Cost-Benefit Analysis (CBA), Australian Treasury, Australian Centre for Evaluation. NPV and BCR; last updated 2 July 2025.
- Valuing the Future: the social discount rate in cost-benefit analysis, Productivity Commission (Mark Harrison, 2010).
- About monetary policy, Reserve Bank of Australia. The 2 to 3% inflation target.
- 16.2 Net Present Value (NPV) Method, OpenStax.
- 15.1 Risk and Return to an Individual Asset, OpenStax. Arithmetic versus geometric average returns.
Open the Present and Future Value Calculator
More Calculators
Every tool in the Calculators section, free and in your browser.
- Investment Calculator
- Compound Interest Calculator
- Simple Interest Calculator
- Interest Calculator
- EMI Calculator
- Retirement Calculator
- Time-Weighted Return Calculator
- Savings Goal Calculator
- Inflation Calculator
- CAGR Calculator
- ROI Calculator
- Present and Future Value Calculator
- NPV and IRR Calculator
- 401(k) Calculator
- Roth IRA Calculator
- APY and CD Calculator
- SIP Calculator
- Annuity Calculator
- Bond Price and Yield Calculator
- Currency Converter
- Dividend Calculator
- Stock Average Calculator
- RMD Calculator