
Time-Weighted vs Money-Weighted Return: ETFs and Super
Why your ETF or managed fund return differs from the fund's published figure: TWR and XIRR in Australian dollars, ASIC's five-year rule for ads, DRPs and super.
By Redbison Dev · · 6 min read
Australia edition. Worked in Australian dollars on an Australian-listed ETF, with ASIC's RG 234 standard periods for advertised returns, APRA's performance test for super products, and how to treat brokerage and DRP units. US edition
Two investors buy the same Australian-listed ETF in August 2023 and again in February 2025, each putting in $15,000 in total. On 6 November 2026 the units are worth $105, up from $95 at the start, and the ETF's time-weighted return over that time is 10.53%, or 3.11% a year, for both of them. Their money-weighted returns are 1.95% and 0.21% a year. Both figures are correct; they answer different questions. This edition explains time-weighted and money-weighted return for Australian investors, with every figure from the Australian investment return calculator. It looks back at past results only and is not advice about any product.
What each measure is for
Time-weighted return (TWR) judges the investment. It cuts the holding period at each purchase or sale, measures each piece by the change in unit price, and multiplies the pieces together, so the investor's deposits and withdrawals have no effect. The GIPS standards, the global code for presenting managers' performance, require firms to present time-weighted returns except where the firm controls the cash flows and the fund is, for example, closed-end or fixed-life.
Money-weighted return, calculated as XIRR, judges your own result. It is the single annual rate at which all your purchases, sales and today's value balance. Microsoft's documentation for the spreadsheet function says it discounts each payment on a 365-day year; the calculator does the same.
Two investors, one ETF
The unit price was $95 on 1 August 2023, $110 on 3 February 2025 and $105 on 6 November 2026.
| Mostly early | Mostly late | |
|---|---|---|
| 1 August 2023 at $95 | $10,000 (105.26 units) | $5,000 (52.63 units) |
| 3 February 2025 at $110 | $5,000 (45.45 units) | $10,000 (90.91 units) |
| Value on 6 November 2026 at $105 | $15,825 | $15,072 |
| Gain on $15,000 | $825 (5.50%) | $72 (0.48%) |
| Time-weighted return | 10.53% (3.11% a year) | 10.53% (3.11% a year) |
| XIRR | 1.95% a year | 0.21% a year |
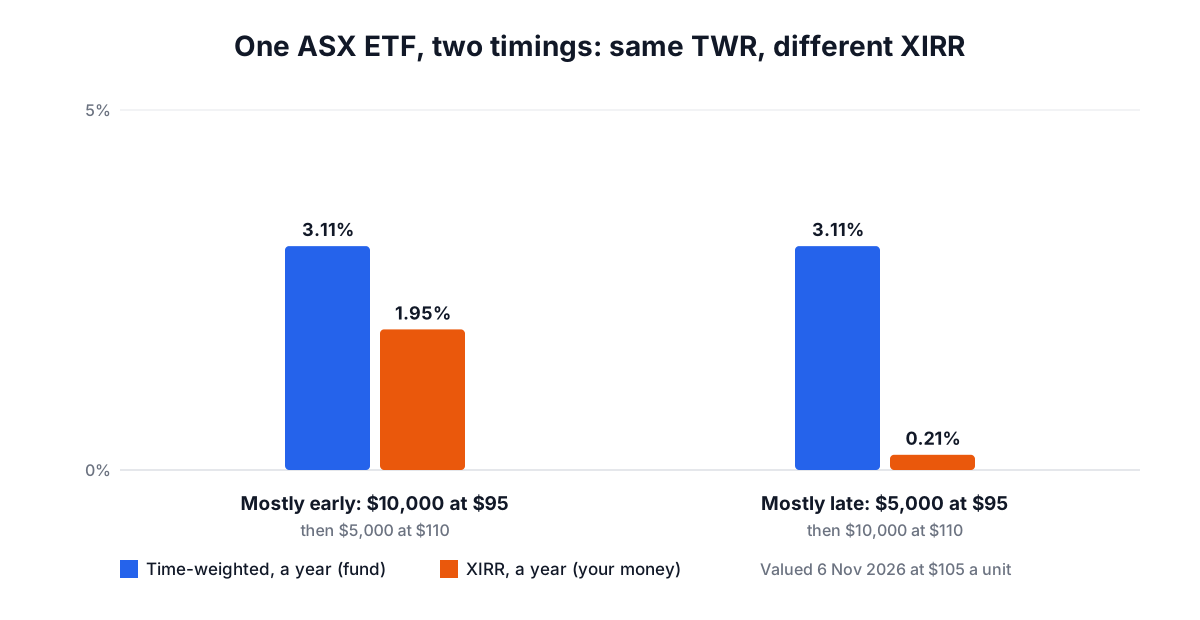
The TWR chains $95 to $110 (+15.79%) and $110 to $105 (−4.55%): 1.1579 × 0.9545 = 1.1053. Both investors see it, because both held the ETF over the same dates. Their XIRRs sit below it because each put money in at $110, after most of the rise; the one who put $10,000 in at that price did worse. That is not the ETF's fault: topping up after a good run is a choice whose effect only the money-weighted figure shows.
Annualise before you compare
The 10.53% TWR took 3.27 years, so its annual rate is 1.1053^(1 ÷ 3.27) − 1 = 3.11%. XIRR is already annual. Setting the cumulative 10.53% beside a 1.95% XIRR would exaggerate the gap several times over.
How published returns are presented in Australia
ASIC's Regulatory Guide 234 on advertising financial products (June 2026) says an advertisement that refers to past performance should include standardised periods: the single figure for the per annum return over the previous five years, or for the whole period the investment has been available if that is less than five years. ASIC notes that "year" here means 12 months, not a calendar or financial year, and that standardised-period figures should be at least as prominent as any others. It also warns that using an inappropriately short period, or picking periods that flatter performance, may mislead; one of its examples is a super fund trustee that advertised 10-year figures that were not the most recent available.
Those published figures describe the product over a fixed window. Your XIRR covers your own dates and your own cash flows, so the two will rarely match. To compare fairly, look up the product's unit prices on your first and last dates and work out its TWR for exactly your period.
Super is judged at product level too
APRA's annual performance test assessed 50 MySuper products against tailored benchmarks in 2026, along with several hundred trustee-directed products. That test, like the investment option returns your fund reports, is about the product. You can put your own super contributions and balance through the calculator, but a super balance moves for reasons other than investment returns, such as fees and any insurance premiums deducted, so the XIRR mixes those in. Use the option's reported return to judge the investment, and your XIRR only to see what your account as a whole has done.
Brokerage, distributions and DRPs
- Brokerage is part of what you paid. Include it in each purchase amount so the return is what you actually earned.
- Distributions paid to your bank account are returns you took out. Enter each as a sell on its payment date, or the XIRR understates.
- Distribution reinvestment plans (DRPs) buy new units with the fund's money, not yours. They are already in the current value, so leave them out of buys.
Regular investing
$500 on the 5th of each month from November 2023 to October 2026 is $18,000 invested. If it is worth $20,800 on 6 November 2026, the gain is $2,800, or 15.56% of what went in, and the XIRR is 9.58% a year. The annual rate is well above a third of the total because the average dollar has been invested for about 18 months, not three years.
Using the calculator
- Clear the sample data. Add each purchase as a buy in dollars with its date, including brokerage, and the units if you want the TWR.
- Add sales and cash distributions as sells.
- Enter today's market value and note the date; XIRR moves with it.
- Compare the XIRR with the product's TWR over the same dates.
Your transactions are stored only in this browser.
Common mistakes
- Comparing your XIRR with a five-year per annum figure over different dates.
- Comparing a cumulative TWR with an annual XIRR without annualising.
- Counting DRP units as new money.
- Reading a short-period XIRR literally. A few weeks of gains, annualised, can look extraordinary.
- Using unit prices of one ETF to value a mixed portfolio. A whole-portfolio TWR needs the total value on every cash-flow date.
What to take away
Judge a fund or ETF by its time-weighted return against its benchmark over a standard period, and judge your own decisions by your XIRR. The Australian ETF fees and dividends guide shows what fees take from both, and the compound interest guide for Australia shows how time in the market adds up. ASIC's guide expects an advertisement that uses past performance to warn that it is not indicative of future performance, and the same caution applies to your own figures. For a decision about your own portfolio or super, speak to a licensed financial adviser.
Frequently asked questions
Why is my return lower than the ETF's published return?
A fund's published return is measured on its unit price over a fixed period, so it ignores when you bought. Your XIRR reflects your own purchase dates and amounts, and includes brokerage. If you added money after a rise, your XIRR will usually trail the fund's figure.
What period do advertised investment returns use in Australia?
ASIC's RG 234 says advertisements that refer to past performance should include the per annum return over the previous five years, or over the whole life of the investment if shorter, with "year" meaning 12 months.
How do I treat a DRP in the calculator?
Leave the reinvested units out of the buys; they are already in the current value. Cash distributions paid to you go in as sells on their payment dates.
Can I use XIRR for my super?
You can, entering contributions as buys and the balance as the value, but the result mixes fees and any insurance premiums with investment performance. Your fund's reported option return is the better measure of the investment itself.
Is XIRR the same as annualised return?
For one investment held to today, yes. With several dated amounts, XIRR is the one annual rate that balances them all against today's value.
Sources and further reading
- RG 234 Advertising financial products and services (including credit), Australian Securities and Investments Commission.
- RG 234 full text, June 2026 (PDF), Australian Securities and Investments Commission. RG 234.83 to 234.101 on past performance and standardised periods.
- Annual superannuation performance test, Australian Prudential Regulation Authority.
- 2020 GIPS Standards for Firms, CFA Institute. Provision 1.A.35.
- XIRR function, Microsoft Support. The 365-day convention.
- Time-weighted vs money-weighted return (US edition).
Open the Time-Weighted Return Calculator
More Calculators
Every tool in the Calculators section, free and in your browser.
- Investment Calculator
- Compound Interest Calculator
- Simple Interest Calculator
- Interest Calculator
- EMI Calculator
- Retirement Calculator
- Time-Weighted Return Calculator
- Savings Goal Calculator
- Inflation Calculator
- CAGR Calculator
- ROI Calculator
- Present and Future Value Calculator
- NPV and IRR Calculator
- 401(k) Calculator
- Roth IRA Calculator
- APY and CD Calculator
- SIP Calculator
- Annuity Calculator
- Bond Price and Yield Calculator
- Currency Converter
- Dividend Calculator
- Stock Average Calculator
- RMD Calculator