
CAGR, XIRR, NPV and Present Value in Rupees
Time value of money in ₹: SEBI's CAGR rule for fund adverts, why a SIP needs XIRR, PPF maturity as a future value, and NPV for a small business decision.
By Redbison Dev · · 9 min read
India edition. Indian edition in rupees with lakh grouping, using SEBI's rule that mutual fund performance is advertised as CAGR with a ₹10,000 figure, AMFI's 13% ceiling for return calculators, and the PPF rate and deposit limit published by the National Savings Institute. US edition
Money received today is worth more than the same money later because it can earn something in the meantime, and almost every return figure an Indian investor sees is built on that idea. Mutual fund adverts must show returns as CAGR, a SIP statement should show XIRR, a PPF passbook is a future value of yearly deposits, and a business deciding whether to put ₹12 lakh into rooftop solar is doing a net present value. Mixing these up is how a SIP that earned about 15% a year gets described as 25% or as 7.7%.
All figures below come from the CAGR Calculator (India), the Investment Returns Calculator (India) for XIRR, the Present and Future Value Calculator and the NPV and IRR Calculator. They explain the arithmetic; they are not investment advice, and past returns say nothing certain about future ones. The US version is here.
One factor behind every figure
Each measure here is the same growth factor, (1 + r)^n, used forwards or backwards. At 12% a year for 10 years the factor is 3.1058, so ₹5,00,000 invested once becomes ₹15,52,924. At 7.2% the factor is 2.0042 and the same ₹5 lakh becomes ₹10,02,116. Dividing by the factor runs it the other way: a payment of ₹15,52,924 due in 10 years is worth ₹5,00,000 today to someone who can earn 12%.
Those two rates are not random. AMFI's best-practice circular of 1 November 2023 lists the mean 10-year rolling returns of benchmarks between June 2013 and May 2023, including 12.93% for the Nifty 50 and 7.20% for the 10-year G-Sec, and says goal and SIP calculators offered by fund houses may let investors pick returns between 2% and 13%, not higher. The circular also says these illustrative rates are reviewed every year, so check AMFI for a later version.
CAGR: the number on every fund advert
SEBI's circular CIR/IMD/DF/23/2017 (15 March 2017) requires mutual fund performance adverts to show CAGR for the past 1, 3 and 5 years and since inception, plus the point-to-point value of a standard ₹10,000 investment. A scheme less than a year old may not advertise past performance at all, and the advert must say whether the figures are for the regular or the direct plan.
CAGR = (ending value ÷ starting value)^(1 ÷ years) − 1
If an advert says ₹10,000 became ₹17,623 in five years, the CAGR is 12.00%. The total gain of 76.23% divided by five suggests 15.25% a year, which overstates the return because it ignores compounding. That gap is why SEBI prescribes CAGR.
CAGR fits one lump sum held for the whole period. It does not fit money that went in at different times.
Why a SIP needs XIRR, not CAGR
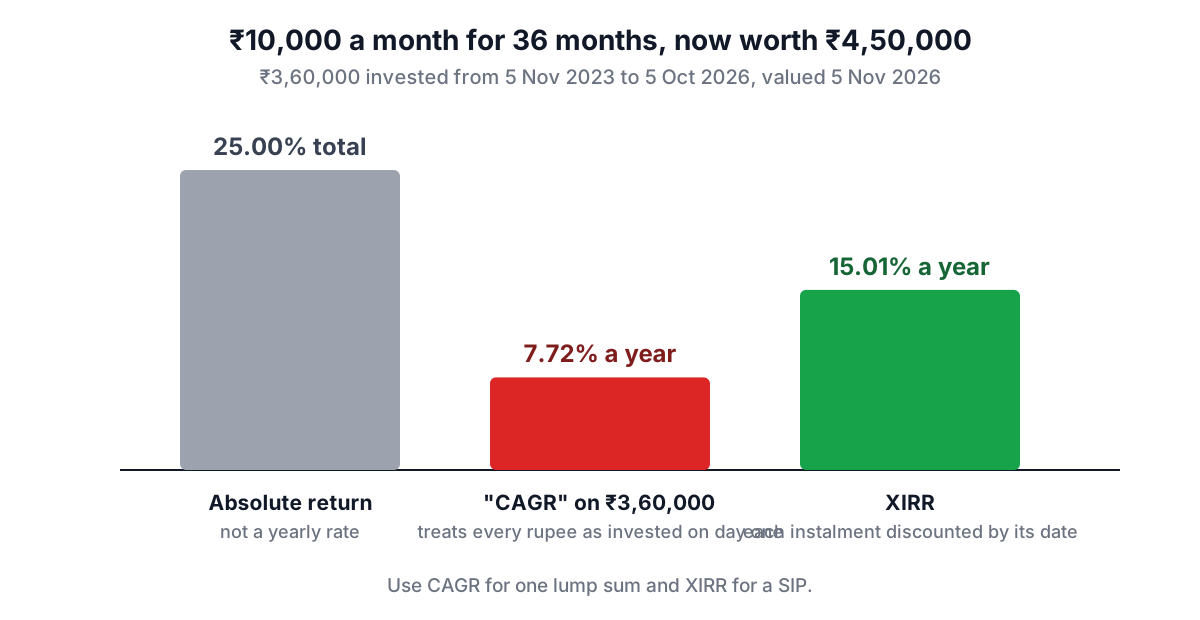
Take a SIP of ₹10,000 on the 5th of every month for 36 months, from 5 November 2023 to 5 October 2026: ₹3,60,000 invested. On 5 November 2026 the units are worth ₹4,50,000.
| Measure | Working | Result |
|---|---|---|
| Absolute return | 4,50,000 ÷ 3,60,000 − 1 | 25.00% |
| "CAGR" on the total over 3 years | (4,50,000 ÷ 3,60,000)^(1/3) − 1 | 7.72% a year |
| XIRR on the dated instalments | rate at which the 37 flows' present value is zero | 15.01% a year |
The 7.72% is wrong because it pretends all ₹3,60,000 was invested on day one; in fact the last instalment was in the market for a month. The 25% is a total, not a yearly rate. XIRR discounts each instalment by its own date and finds the single annual rate that balances them. In the Investment Returns Calculator, enter each instalment as money in with its date and the current value as money out.
For when a lump sum beats a SIP and vice versa, see the Indian guide to SIP versus lump sum; for the difference between the fund's return and yours, the Indian guide to time-weighted and money-weighted returns.
PPF: future value of yearly deposits
The National Savings Institute's PPF page sets the deposit range at ₹500 to ₹1,50,000 per financial year, with the account maturing after fifteen complete financial years from the end of the year it was opened. Its rate table lists 7.1% a year from 1 April 2020 to 30 September 2026, and the same table shows how often the rate has changed in the past, so check the current rate before relying on it.
As an illustration, deposit the full ₹1,50,000 at the start of each financial year for 15 years and assume 7.1% compounding once a year:
| Amount | |
|---|---|
| Total deposited | ₹22,50,000 |
| Value after 15 years | ₹40,68,209 |
| Interest earned | ₹18,18,209 |
In the Present and Future Value Calculator that is a payment of 1,50,000 a year for 15 years at 7.1%, payments at the start of each period (annuity due). Depositing at the end of each year instead gives every deposit one year less of interest. The passbook figure will differ, because the scheme rules rather than this simple yearly model decide how interest is credited, and because the rate can change over 15 years.
NPV: is a ₹12 lakh investment worth it?
A small manufacturer is quoted ₹12,00,000 for a rooftop solar system expected to cut its electricity bill by ₹2,60,000 a year for 10 years. There is no official discount rate for a private decision like this; use the return the owner could earn elsewhere or the interest on the loan that would pay for it. Enter -1200000 then ten flows of 260000:
| Discount rate | NPV |
|---|---|
| 10% | ₹3,97,587 |
| 12% | ₹2,69,058 |
| IRR | 17.26% |
The simple payback is 4.62 years; discounted at 10% it is 6.51 years. Positive NPV at the owner's rate means the system adds value at that rate; the IRR of 17.26% says how far the rate could rise before it stops doing so. If the savings forecast assumes tariffs that rise with inflation, use a nominal discount rate too; do not mix a real rate with inflated savings.
Choosing the right measure
- Lump sum held for the whole period: CAGR. It is what fund adverts show.
- SIP, top-ups or partial redemptions: XIRR.
- Regular deposits at a known rate (PPF, RD): future value of an annuity, with the right payment timing.
- A business outlay followed by savings or income: NPV at your required return, with IRR as a cross-check.
- Never divide a total return by the number of years.
The Indian compound interest guide covers compounding frequency and how to compare effective rates.
Frequently asked questions
What is the difference between CAGR and XIRR?
CAGR is the yearly growth rate of one amount between two dates. XIRR is the yearly rate that accounts for several investments and withdrawals on different dates. For a single lump sum they are the same; for a SIP, CAGR on the total invested understates the return. A 36-month ₹10,000 SIP worth ₹4,50,000 has an XIRR of 15.01% but a misleading "CAGR" of 7.72%.
Why do mutual fund adverts show CAGR?
Because SEBI's 2017 circular on mutual fund advertisements requires performance to be shown as CAGR for 1, 3 and 5 years and since inception, together with the value of a ₹10,000 investment over the same periods.
What return can a fund house's SIP calculator assume?
AMFI's circular of 1 November 2023 allows goal planning and SIP calculators to offer returns from 2% to 13%, with 13% as the ceiling, because the highest mean 10-year rolling return in its table was 12.93% for the Nifty 50. The circular says the figures are reviewed annually.
How much will ₹1.5 lakh a year in PPF grow to in 15 years?
At 7.1% compounding yearly with deposits at the start of each year, about ₹40,68,209 on ₹22,50,000 deposited. Treat it as an estimate: the rate can change and the passbook calculation follows the scheme rules.
Is absolute return the same as annual return?
No. Absolute return is the total gain over the whole period, such as 25% over three years. To compare it with an FD rate or another fund, convert it to an annual figure: CAGR for a lump sum, XIRR for instalments.
Sources and further reading
- Review of advertisement guidelines for Mutual Funds (CIR/IMD/DF/23/2017), Securities and Exchange Board of India. CAGR for 1, 3, 5 years and since inception, the ₹10,000 figure, regular or direct plan, nothing under one year.
- AMFI Best Practices Guidelines Circular No. 109/2023-24, Association of Mutual Funds in India. Mean 10-year rolling returns and the 13% calculator ceiling.
- Public Provident Fund Account, National Savings Institute, Ministry of Finance. Deposit limits and maturity.
- PPF interest rate since inception, National Savings Institute. 7.1% from 1 April 2020 to 30 September 2026.
- 16.2 Net Present Value (NPV) Method, OpenStax.
- XIRR function, Microsoft Support. How spreadsheet XIRR treats dated cash flows.
Open the Present and Future Value Calculator
More Calculators
Every tool in the Calculators section, free and in your browser.
- Investment Calculator
- Compound Interest Calculator
- Simple Interest Calculator
- Interest Calculator
- EMI Calculator
- Retirement Calculator
- Time-Weighted Return Calculator
- Savings Goal Calculator
- Inflation Calculator
- CAGR Calculator
- ROI Calculator
- Present and Future Value Calculator
- NPV and IRR Calculator
- 401(k) Calculator
- Roth IRA Calculator
- APY and CD Calculator
- SIP Calculator
- Annuity Calculator
- Bond Price and Yield Calculator
- Currency Converter
- Dividend Calculator
- Stock Average Calculator
- RMD Calculator