
Present Value and NPV in Canada: TBS Rates, TFSA, Mortgages
Time value of money in Canadian dollars: the Treasury Board's 7% and 3% discount rates, TFSA growth, half-yearly mortgage compounding and CAGR.
By Redbison Dev · · 9 min read

Canada edition. Canadian edition in CA$, using the Treasury Board Secretariat's 7% and 3% discount rates for cost-benefit analysis, the 2026 TFSA and RRSP dollar limits from the CRA, and half-yearly compounding under the Interest Act. US edition
Money in hand today beats the same amount later because it can be invested in the meantime. In Canadian federal regulation that idea has a fixed price: the Treasury Board of Canada Secretariat (TBS) recommends discounting future costs and benefits at 7% a year, with a 3% social discount rate where a proposal mainly affects consumption or runs 50 years or more. At home the same arithmetic explains why a TFSA funded each January beats one funded each December, and why a Canadian mortgage rate quoted "compounded half-yearly" costs less than the same number compounded monthly.
Every figure below comes from the Present and Future Value Calculator, the NPV Calculator (Canada), the CAGR Calculator or the ROI Calculator, in Canadian dollars. It explains the math; it is not investment advice. The US version is here.
The federal convention: 7%, 3% and constant dollars
The Policy on Cost-Benefit Analysis (section 7.1) requires departments to use the opportunity cost of capital set out in the TBS Cost-Benefit Analysis Guide, except where a social discount rate fits better, for example when a regulation mainly affects private consumption or its effects last 50 years or more. Even then, results at the opportunity cost of capital must also be reported. TBS's annual report on regulatory management puts the numbers on it: 7%, based on a weighted average of foreign and domestic sources of capital, and 3% as the social rate.
Two more requirements shape every federal NPV:
- At least 10 years. Section 7.4 asks for present values over a minimum 10-year period from registration, unless the regulations explicitly prescribe a different period (for example, regulations that sunset sooner).
- One price year. Monetary values are converted to a common base year with Statistics Canada's Consumer Price Index before discounting. In other words, the 7% is applied to constant dollars, not to forecasts that include inflation.
The Red Tape Reduction Regulations add their own twist: administrative burden figures are expressed in 2012 dollars and discounted to 2012 at 7%, so those totals are not comparable with an ordinary present value.
Worked example: a regulation that depends on the rate
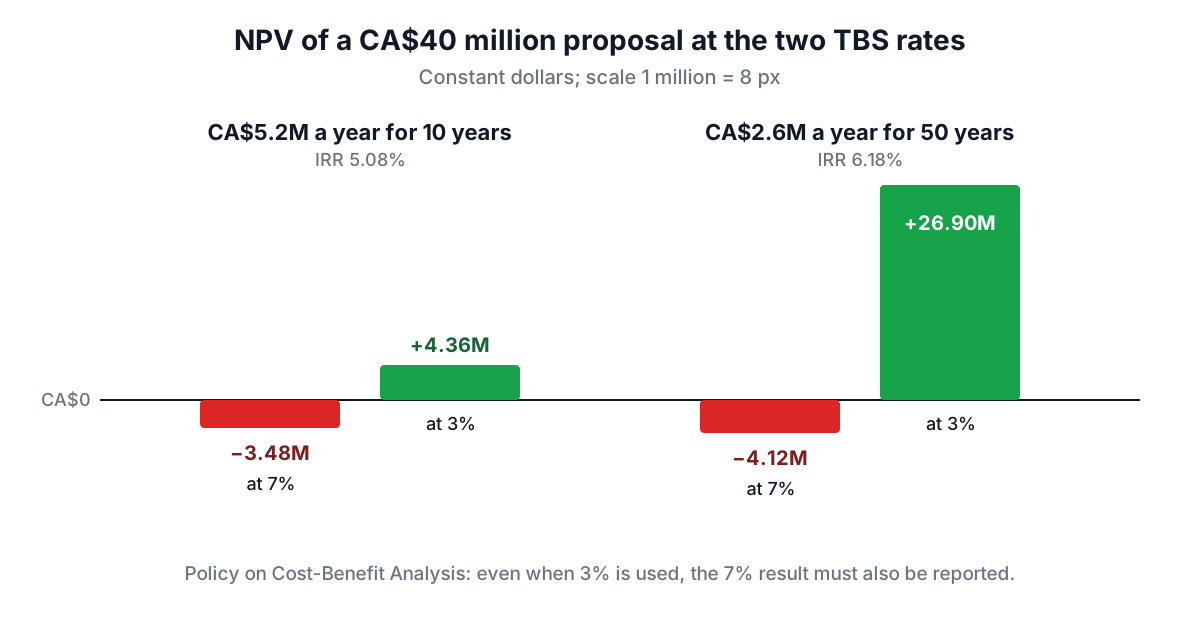
A proposal costs industry CA$40 million up front and delivers CA$5.2 million a year of benefits for 10 years, in constant dollars. Enter -40000000 followed by ten flows of 5200000:
| Rate | NPV |
|---|---|
| 7% (opportunity cost of capital) | -CA$3,477,376 |
| 3% (social discount rate) | CA$4,357,055 |
| IRR | 5.08% |
Because the IRR sits between the two federal rates, the verdict flips with the rate. Undiscounted, the outlay is recovered in 7.69 years; discounted at 7%, it is not recovered within the 10 years at all. A department arguing for the 3% rate would still have to show the negative 7% figure under section 7.1.
The longer the horizon, the bigger the gap. Spread over 50 years at CA$2.6 million a year, the same CA$40 million is -CA$4,118,060 at 7% but CA$26,897,386 at 3%. That is the kind of long-lived case where the policy allows the social rate, and why it insists on seeing both.
Present value of a mortgage: why half-yearly matters
Section 6 of the Interest Act says a blended-payment mortgage must state its rate "calculated yearly or half-yearly, not in advance". A rate stated half-yearly has to be converted before it can be used with monthly payments:
monthly rate = (1 + 0.05 / 2)^(2/12) − 1 = 0.41239%
effective annual rate = 1.025^2 − 1 = 5.0625%
The monthly payment is the amount whose present value, at that monthly rate, equals the loan. On CA$500,000 over 25 years (300 payments):
| 5% stated as | Monthly rate | Monthly payment |
|---|---|---|
| Compounded half-yearly | 0.41239% | CA$2,908.02 |
| Compounded monthly | 0.41667% | CA$2,922.95 |
Check it in the Present and Future Value Calculator: enter a payment of 2,908.02 for 25 years at 5% with half-yearly compounding and monthly payments, and the present value comes back as CA$499,999, the CA$500,000 loan to within rounding. The calculator converts the rate to the payment period itself and shows the rate it used.
TFSA and RRSP: future value of yearly contributions
The CRA's limits table sets the 2026 TFSA dollar limit at CA$7,000 and the 2026 RRSP dollar limit at CA$33,810, ceilings that apply before your own contribution room is worked out. Suppose you put the full CA$7,000 into a TFSA every year for 20 years and it earns 5% a year, an assumption for the arithmetic only:
| Contribution timing | Value after 20 years |
|---|---|
| Each January (start of year) | CA$243,035 |
| Each December (end of year) | CA$231,462 |
The CA$11,573 difference is one extra year of growth on every contribution. In the calculator it is the switch between payments at the start of each period (annuity due) and at the end (ordinary annuity).
CAGR on a TFSA, and ROI
A TFSA that grew from CA$40,000 to CA$58,000 in five years, with nothing added or withdrawn, has a CAGR of 7.71%. Dividing the 45% gain by five says 9%, which overstates it because it ignores compounding. If you contributed along the way, the two balances mix your deposits with growth; the Canadian guide to time-weighted and money-weighted returns covers that case.
Annualized ROI uses the same root: (1 + total return)^(1 ÷ years) − 1. A brokerage statement's "45% since purchase" is a very different result over three years than over twelve.
Real or nominal: pick one
TBS works in constant dollars and a real 7%. If you hold nominal forecasts instead, convert the rate, not by adding inflation but with:
nominal = (1 + real) × (1 + inflation) − 1
1.07 × 1.02 − 1 = 9.14%, not 9%
The 2% here is the midpoint of the Bank of Canada's 1% to 3% inflation-control target range. Discounting nominal forecasts at a real rate overstates their present value; discounting constant-dollar flows at a nominal rate understates it.
For more on compounding frequency and effective rates, see the Canadian compound interest guide.
Frequently asked questions
What discount rate does the Government of Canada use for cost-benefit analysis?
TBS recommends 7%, based on a weighted average of foreign and domestic sources of capital. A social discount rate of 3% may be appropriate where a proposal mainly affects private consumption or its impacts last 50 years or more, but results at the opportunity cost of capital must also be reported.
Does the 7% TBS rate include inflation?
No. The policy asks departments to convert values to a common price year using the Consumer Price Index, so the rate is applied to constant dollars. Do not discount inflated forecasts at 7%.
How do I convert a semi-annual mortgage rate to a monthly rate?
Divide the stated rate by 2, add 1, raise to the power 2/12 and subtract 1. For 5% that is 0.41239% a month, and a CA$500,000 mortgage over 25 years costs CA$2,908.02 a month.
Is it better to contribute to a TFSA in January or December?
With any positive return, January wins because each contribution grows for an extra year. At an assumed 5%, CA$7,000 a year for 20 years reaches CA$243,035 when paid each January and CA$231,462 when paid each December.
What is the minimum period for a federal cost-benefit analysis?
Ten years from the date the regulations are registered, under section 7.4 of the Policy on Cost-Benefit Analysis, unless the regulations explicitly prescribe a different period.
Sources and further reading
- Policy on Cost-Benefit Analysis, Treasury Board of Canada Secretariat. Sections 7.1 (discount rate), 7.4 (time period and price year) and 7.5 (sensitivity analysis).
- Annual Report for the 2023 to 2024 Fiscal Year: Federal Regulatory Management Initiatives, Treasury Board of Canada Secretariat. The 7% recommendation, the 3% social rate and the 2012-dollar convention.
- MP, DB, RRSP, DPSP, ALDA, TFSA limits, YMPE and the YAMPE, Canada Revenue Agency. 2026 TFSA dollar limit CA$7,000 and RRSP dollar limit CA$33,810.
- Interest Act, section 6, Justice Laws Website. Mortgage rates calculated yearly or half-yearly, not in advance.
- Inflation-control target, Bank of Canada. The 2% midpoint of the 1% to 3% target range.
- 16.2 Net Present Value (NPV) Method, OpenStax.
Open the Present and Future Value Calculator
More Calculators
Every tool in the Calculators section, free and in your browser.
- Investment Calculator
- Compound Interest Calculator
- Simple Interest Calculator
- Interest Calculator
- EMI Calculator
- Retirement Calculator
- Time-Weighted Return Calculator
- Savings Goal Calculator
- Inflation Calculator
- CAGR Calculator
- ROI Calculator
- Present and Future Value Calculator
- NPV and IRR Calculator
- 401(k) Calculator
- Roth IRA Calculator
- APY and CD Calculator
- SIP Calculator
- Annuity Calculator
- Bond Price and Yield Calculator
- Currency Converter
- Dividend Calculator
- Stock Average Calculator
- RMD Calculator