
Body Fat, Healthy Weight and Macros: A UK Reader's Guide
Tape-measure body fat in inches and stones, the NHS half-your-height waist rule, NICE lower BMI thresholds and UK protein and carb advice.
By Redbison Dev · · 9 min read
United Kingdom edition. Works in stones, pounds and inches, reads the results against the NHS waist-to-height rule and the NICE NG246 thresholds, and sets macros beside the UK government dietary recommendations instead of US ranges. US edition
Three numbers tell you more about your body than the bathroom scales: your waist against your height, an estimate of how much of your weight is fat, and where your food energy comes from. In the UK the first one carries the most official weight, because the NHS and NICE now ask adults to keep their waist to less than half their height. This guide shows how the UK body fat calculator, the UK ideal weight calculator and the UK macro calculator fit around that rule, with examples in stones and inches.
It is general information for healthy adults. If you are pregnant, have an eating disorder, or live with diabetes, kidney disease or another long-term condition, talk to your GP practice or a registered dietitian before acting on any of these numbers.
Start with the tape: waist against height
NICE guideline NG246 (recommendation 1.9.14) sorts adults with a BMI under 35 into three bands by waist-to-height ratio: 0.4 to 0.49 is healthy, 0.5 to 0.59 is increased central adiposity, and 0.6 or more is high. NICE says the bands work for both sexes, every ethnicity and people with a lot of muscle, which BMI does not. The NHS turns this into one sentence: keep your waist to less than half your height.
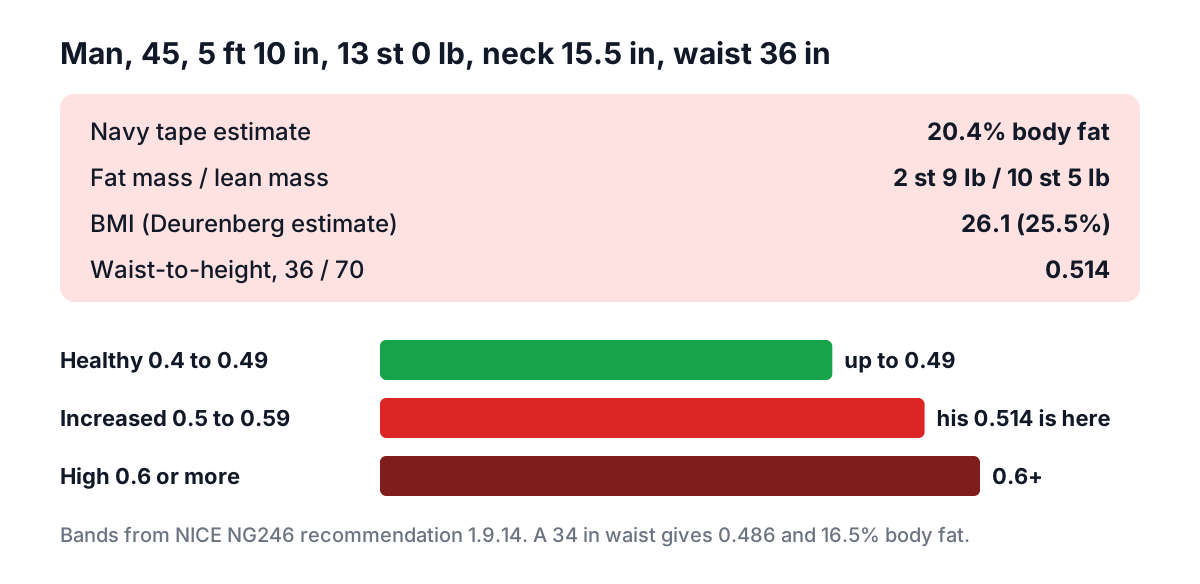
Divide waist by height in the same unit. A man of 5 ft 10 in (70 in) with a 36 in waist has a ratio of 0.514, just inside "increased". At 34 in he would be at 0.486, back in the healthy band. NICE's own example is a 38 in waist at 5 ft 7 in, a ratio of 0.57.
The NHS online ratio tool is not meant for under-5s, pregnancy, eating disorders, conditions that affect height, or adults with a BMI over 35. For those groups a GP or pharmacist is the better route.
Body fat from the same tape
The body fat calculator uses the US Navy circumference method: neck and waist for men, neck, waist and hips for women, plus height. Enter inches and stones directly; the formula itself runs in inches.
Worked example: a 13-stone man
A 45-year-old man, 5 ft 10 in and 13 st 0 lb, with a 15.5 in neck and a 36 in waist:
| Result | Value |
|---|---|
| Navy tape estimate | 20.4% body fat |
| Fat mass | 2 st 9 lb |
| Lean mass | 10 st 5 lb |
| BMI | 26.1 (overweight on the standard bands) |
| BMI-based (Deurenberg) estimate | 25.5% |
| Waist-to-height | 0.514 (increased central adiposity) |
The tape figure is five points lower than the BMI-based one, which usually means more muscle than average for his BMI. Even so, the waist-to-height ratio says his midsection is where the risk sits. Losing two inches from his waist would bring the ratio to 0.486 and the tape estimate down to 16.5%, a better target than any number on the scales.
Worked example: a woman with a "healthy" BMI
A 38-year-old woman, 5 ft 5 in and 10 st 7 lb, neck 13 in, waist 31 in, hips 40 in, comes out at 32.3% body fat, with 3 st 6 lb of fat. Her BMI is 24.5, inside the healthy range, and her waist-to-height ratio is 0.477, inside NICE's healthy band. The 32.3% sits just over the 32% line where the American Council on Exercise bands start "obese", but those bands are US fitness categories, not NHS targets. With a healthy waist ratio, this is a figure to track, not a diagnosis.
How much to trust it
Two habits matter more than the formula. Measure the same way every time: morning, before eating, tape level on bare skin after a normal breath out. And compare a method only with itself. Body composition scales sold on the high street work by bioelectrical impedance and move with hydration; DEXA scans are more accurate, but NHS DEXA is mainly for bone density, so a body composition scan is usually a private test.
Healthy weight: the NHS range, and the lower one NICE uses
The NHS healthy BMI range is 18.5 to 24.9. NICE NG246 (recommendation 1.9.11) adds that people of South Asian, Chinese, other Asian, Middle Eastern, Black African or African-Caribbean family background develop cardiometabolic risk at a lower BMI, so for them overweight starts at 23 and obesity at 27.5. NICE also tells clinicians to read BMI with caution in muscular adults and in people aged 65 and over.
The ideal weight calculator shows both ranges, plus the four classic ideal body weight formulas (Hamwi, Devine, Robinson and Miller). For a woman of 5 ft 4 in:
| Measure | Weight |
|---|---|
| NHS healthy range (BMI 18.5 to 24.9) | 7 st 10 lb to 10 st 5 lb |
| Lower-threshold range (BMI 18.5 to 22.9) | 7 st 10 lb to 9 st 7 lb |
| Hamwi | 8 st 8 lb |
| Devine | 8 st 9 lb |
| Robinson | 8 st 11 lb |
| Miller | 9 st 3 lb |
The formulas cluster in a 9 lb band, while the health-based range is nearly three stone wide. Treat the range as the target and the formulas as landmarks inside it. For a British South Asian or Black African woman of that height, 10 st would be healthy on the standard range and overweight on the one NICE recommends for her.
Macros the UK way
UK advice is not built on the US percentage ranges. The government dietary recommendations, published by Public Health England in 2016 from COMA and SACN reports, set these figures for adults aged 19 to 64:
| Nutrient | Men | Women | Basis |
|---|---|---|---|
| Energy | 2,500 kcal | 2,000 kcal | SACN 2011, capped |
| Protein | 55.5 g | 45 g | COMA 1991 |
| Total fat | under 97 g | under 78 g | 35% of food energy |
| Saturated fat | under 31 g | under 24 g | 11% of food energy |
| Carbohydrate | at least 333 g | at least 267 g | 50% of energy (SACN 2015) |
| Free sugars | under 33 g | under 27 g | 5% of energy |
| Fibre | 30 g | 30 g | SACN 2015 |
Two things follow. Carbohydrate has a floor, not a band: at least half of your energy. And the protein figure is a minimum to avoid deficiency, not a training target.
The UK macro calculator checks your split against the carbohydrate floor and the fat ceiling. A 38-year-old woman of 66 kg and 165 cm, lightly active and losing weight, gets 1,474 kcal. The common "balanced" 25/45/30 split gives 92 g protein, 166 g carbohydrate and 49 g fat, and the calculator flags the 45% carbohydrate as under the UK minimum. Moving to 20/50/30 gives 74 g protein, 184 g carbohydrate and 49 g fat, with no flags, and 74 g is still about 1.1 g per kg of her weight, well above the 45 g reference.
For someone who trains, protein by body weight works better than a percentage. A 30-year-old man of 80 kg and 180 cm, moderately active, maintains on about 2,759 kcal. At 1.6 g per kg and 30% fat he eats 128 g protein and 355 g carbohydrate, which is 51% of energy and inside UK advice. The International Society of Sports Nutrition position stand puts 1.4 to 2.0 g per kg as the range for people who exercise; the UK reference of 55.5 g is the floor below that.
A UK routine that ties the three together
- Measure height, waist, neck (and hips) and work out your waist-to-height ratio. If it is 0.5 or more, the waist is the first target.
- Record the tape body fat figure and a weight in stones on the same morning.
- Check where your weight sits in the NHS range, or the lower NICE range if it applies to you.
- Set calories (the UK calorie guide explains how), then protein by body weight and carbohydrate at 50% or more of energy if you want to follow UK advice.
- Re-measure every two to four weeks. If your weight falls but your waist does not, raise protein and add strength work before cutting more food. The UK calorie deficit planner shows the pace the NHS recommends, 1 to 2 lb a week.
Tools for this job
- Body fat calculator (UK): tape estimate in inches and stones, with fat and lean mass.
- Ideal weight calculator (UK): the NHS and NICE lower-threshold ranges in stones and pounds.
- Macro calculator (UK): grams of protein, carbohydrate and fat checked against UK advice.
- Waist-to-hip ratio calculator (UK) and BMI calculator (UK) for the other two common screens.
- The BMI guide for the UK explains the NICE thresholds in more depth.
Frequently asked questions
What waist size is healthy for my height in the UK?
Less than half your height. NICE NG246 classes a waist-to-height ratio of 0.4 to 0.49 as healthy, 0.5 to 0.59 as increased and 0.6 or more as high. At 5 ft 10 in that means a waist under 35 in; at 5 ft 4 in, under 32 in.
Why does my body fat estimate say "obese" when my BMI is healthy?
The categories on the results card come from the American Council on Exercise, which starts "obese" at 32% for women and 25% for men. They are not NHS categories. If your waist is under half your height, a borderline percentage is a reason to track the trend, not a diagnosis.
Does the UK recommend 50% of calories from carbohydrate?
Yes. The government dietary recommendations, based on SACN's 2015 report, set carbohydrate at least 50% of energy for adults, with total fat no more than 35% and free sugars under 5%. Low-carbohydrate plans can still lose weight, and NICE accepts them when they create an energy deficit, but they sit outside the national advice.
Is 55.5 g of protein enough for a man?
It is the UK reference intake for men aged 19 to 64, set to cover the needs of almost everyone who is not training. People doing regular resistance exercise, or losing weight, usually aim for 1.4 to 2.0 g per kg, which for an 80 kg man is 112 to 160 g.
Sources and further reading
- Overweight and obesity management (NG246): identifying and assessing overweight, obesity and central adiposity, NICE. Recommendations 1.9.11 to 1.9.15: lower BMI thresholds and waist-to-height bands.
- Obesity, NHS. BMI 23 to 27.4 overweight for the named groups and the half-your-height waist rule.
- Calculate your waist to height ratio, NHS. Who the tool is not for.
- Government Dietary Recommendations, Public Health England, 2016. Table 2: energy, protein, fat, carbohydrate, free sugars and fibre for adults.
- International Society of Sports Nutrition Position Stand: protein and exercise, Journal of the International Society of Sports Nutrition, 2017. Protein for people who train.
- Prediction of Percent Body Fat for U.S. Navy Men from Body Circumferences and Height, US Navy health research report. Hodgdon and Beckett, 1984: the tape equations.
More Fitness Calculators
Every tool in the Fitness Calculators section, free and in your browser.
- BMI Calculator
- Calorie Calculator
- Protein Calculator
- Hydration Calculator
- Calorie Deficit Planner
- Body Fat Calculator
- Ideal Weight Calculator
- Running Pace Calculator
- Target Heart Rate Calculator
- One Rep Max Calculator
- Barbell Plate Calculator
- RPE Calculator
- Interval Timer
- Calories Burned Calculator
- Body Surface Area Calculator
- Waist-to-Hip Ratio Calculator
- VO2 Max Calculator
- Steps to Distance & Calories Calculator